The live windrose
weewx-loopdata manual · weewx-loopdata on GitHub · Report an issue
In addition to the usual observation types (which include windrun), there is a special windrose observation type (new in 6.0, replacing the experimental windrun_<direction> types) for building a live NOAA-style windrose. For each period, loopdata accumulates a matrix of sixteen compass bins (N, NNE, NE, … NNW — clockwise from north) by N wind-speed bands, tracking both time and distance per cell, plus a directionless “calm” total.
windrose works with every period except current and trend — including week, month, year, rainyear and alltime. Span periods seed at startup from the archive, so even alltime.windrose starts fully primed after a restart.
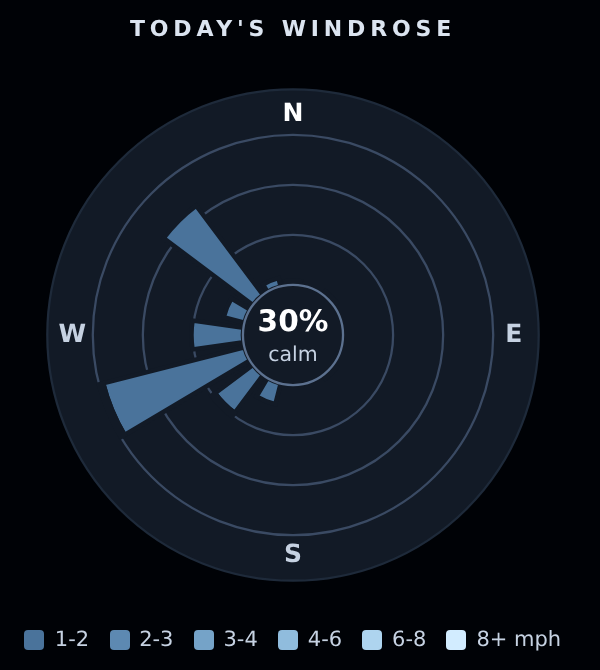
The sample skin drawing day.windrose.banded on a real morning in Palo Alto, with the default speed bands. Each petal’s length is that direction’s share of the day, stacked and shaded by speed band, and the center carries the calm total — the 30% here sits in the middle of the 10–40% that is normal on real roses. Two lobes and a large calm share is what a real site looks like; a rose with every direction filled evenly is a sign the edges want revisiting, which is what Choosing your bands is about.
The four aggregates
Four aggregates project the matrix into json:
day.windrose.sum— sixteen distances (the classic windrun rose), unit-converted to the report’s distance unit; supports a unit override (day.windrose.sum.km) and.formatted(an array of report-formatted strings). Note: wind below the calm threshold counts as calm time, not distance — there is no reliable direction to attribute it to — so on a near-calm day.sumcan be all zeros whilewindrunshows a small total.day.windrose.time— sixteen durations in seconds (a frequency rose).day.windrose.banded— the full 16-by-N matrix of seconds per speed band (the NOAA rose; divide by total time for percentages).day.windrose.calm— seconds of calm: wind below the calm threshold, or no wind direction. Render it as the rose’s center-circle percentage.
(day is just the example — any period except current and trend works: month.windrose.banded, alltime.windrose.sum, 10m.windrose.time, …)
Arrays are emitted as json numbers (charting javascript wants numbers, not strings); .round(n) applies per element (e.g. day.windrose.sum.round(2)).
Two helper keys come along:
- Whenever any windrose field is configured, loopdata also emits a
windrose.bandskey holding the band edges in the report’s windSpeed unit, so a page’s legend never hardcodes them. unit.label.windroseyields the distance unit label for.sum.
The speed bands
The speed bands default to the classic WRPLOT/NOAA bands — 0.5, 2.1, 3.6, 5.7, 8.8 and 11.1 m/s, converted to the report’s windSpeed unit and rounded to one decimal. The first edge doubles as the calm threshold. To override, list ascending edges as windrose_bands on the report’s stanza in weewx.conf (in that report’s windSpeed unit), or under [StdReport] [[Defaults]] for every report (in the Defaults’ unit):
[StdReport]
    [[LoopDataReport]]
        windrose_bands = 1, 4, 8, 13, 19, 25
See windrose_bands per report for the precedence and the pre-7.0 [LoopData] spelling.
Choosing your bands
The default bands suit a windy site; on a light-wind site most of the rose can land in the lowest band (or below the calm threshold entirely). Your archive already knows what your site does — one query shows how your time divides across wind speeds (values are in your database’s unit; convert if your report unit differs):
sqlite3 weewx.sdb "SELECT CAST(windSpeed AS INT) AS speed, \
  ROUND(100.0 * SUM(interval) / (SELECT SUM(interval) FROM archive \
  WHERE windSpeed IS NOT NULL), 1) AS pct_of_time \
  FROM archive WHERE windSpeed IS NOT NULL GROUP BY speed;"
Then place the edges by three rules:
- Calm threshold (the first edge): at or just below the smallest non-zero speed your console reports. Integer-reporting consoles (e.g. Davis Vantage, in mph) spend a lot of time at exactly 1 — an edge of 1.1 silently counts all of it as calm, an edge of 1 keeps it in the rose. Calm percentages of 10–40% are normal on real roses.
- Middle edges: place them so each band carries a real share of the non-calm time (a few percent at minimum) — a band that never fills is a wasted legend entry, and one band holding most of the time is a monochrome rose.
- Top edge: rare on purpose — around the speed you exceed only a few hours a year (the 99.5th percentile or so), so the band at the bright end of the ramp flags genuinely notable wind rather than never appearing at all. (The sample page runs dim to bright with wind speed, where some windrose tools run the other way.)
How many bands is up to you — the default six is the WRPLOT convention, not a limit. The sample page’s palette holds six shades and samples them for however many bands you configure, so seven or eight get seven or eight distinct colors, calmest to windiest. Beyond eight or so the shades start to be hard to tell apart on a small dial, which is a better reason to stop than any rule.
Round numbers in the report unit make the best legend. Iterating is cheap: changing the bands is just an edit and a weewxd restart — every period reseeds from the archive at startup, so the whole rose re-buckets under the new edges.
Drawing a rose
The sample skin draws a live windrose from day.windrose.banded and day.windrose.calm — see skins/LoopData/realtime_updater.inc for javascript to crib from.
Upgrading from windrun_<direction> fields
The experimental windrun_<dir> observation types (loopdata ≤ 5.x) are gone; fields naming them are ignored. The mapping is by compass order: day.windrun_N.sum is now element 0 of day.windrose.sum, day.windrun_NNE.sum element 1, and so on clockwise through NNW (element 15). Unlike windrun_<dir>, windrose accumulators seed every period from the archive at startup, so buckets are no longer empty after a weewxd restart.