The sample skin
weewx-loopdata manual · weewx-loopdata on GitHub · Report an issue
A sample skin (skins/LoopData, registered as the report LoopDataReport) is included with the extension. After installing and restarting, and after waiting for a report cycle, it can be found at <weewx-url>/loopdata/. The skin declares the fields the panel reads in its own skin.conf, so the panel works out of the box on a fresh install.
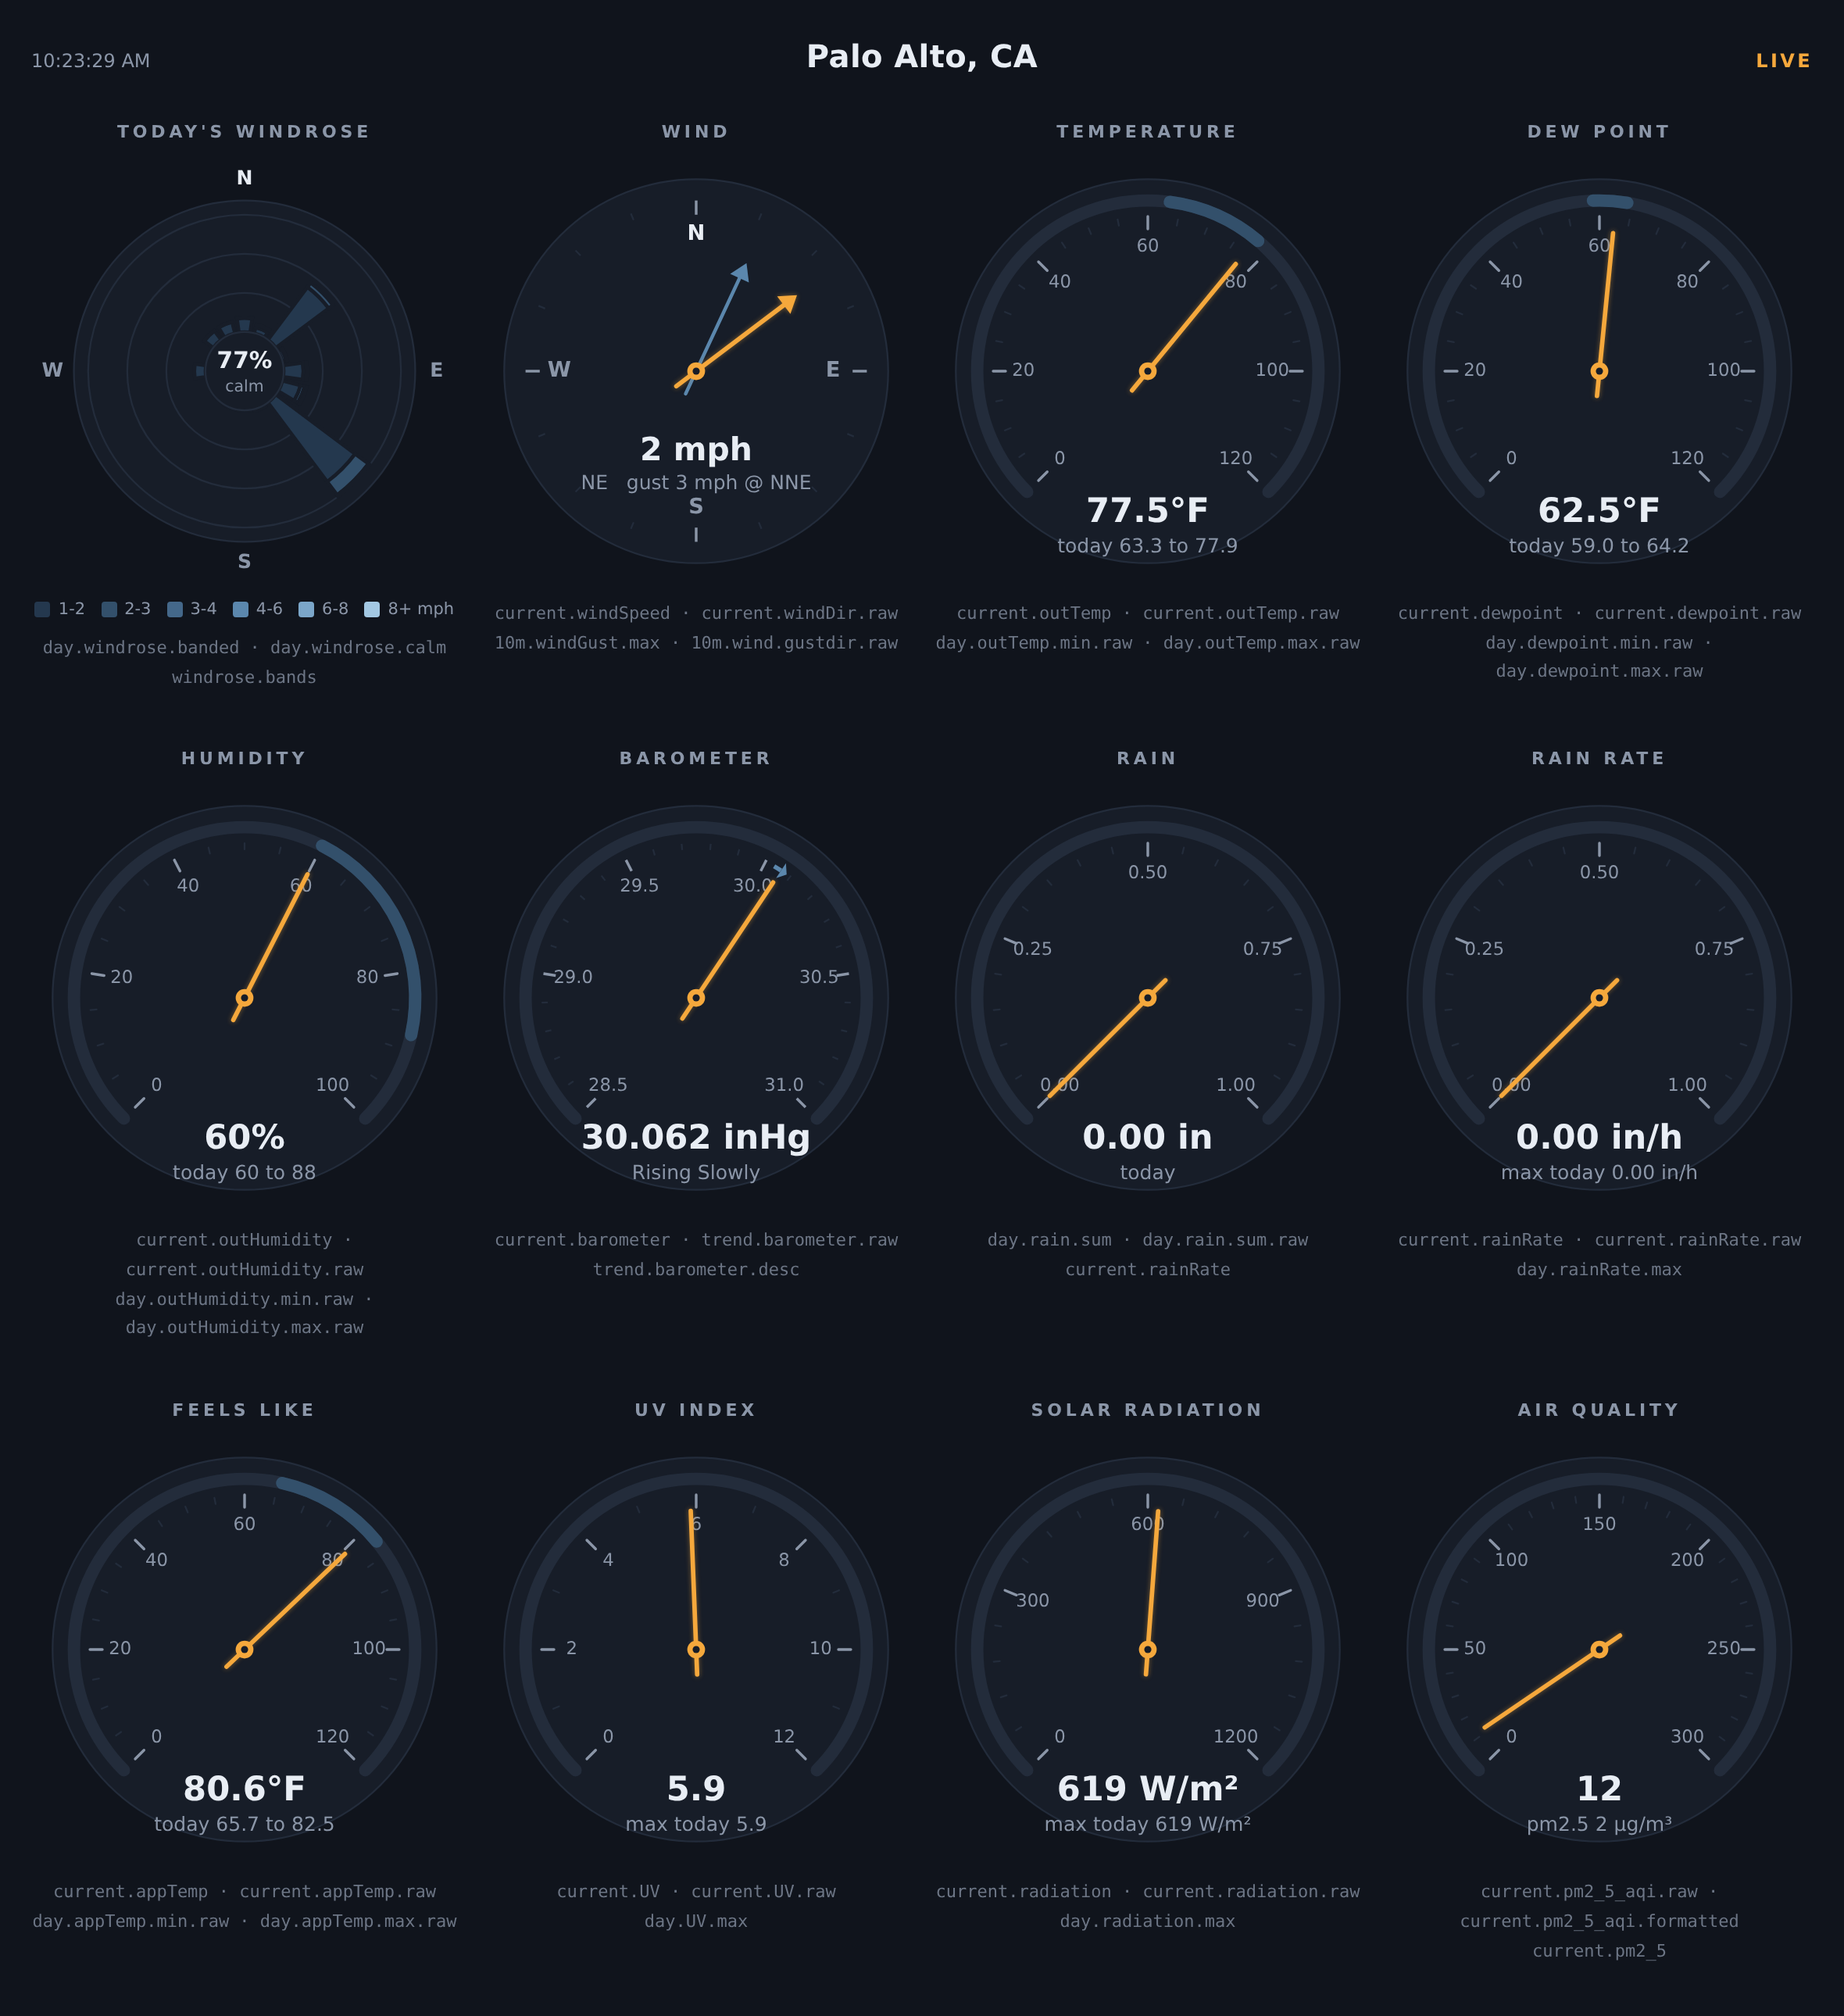
The instrument panel
The page is a NOAA windrose, a wind compass and ten dials, drawn as SVG by a few hundred lines of dependency-free javascript — and every needle, petal and reading redraws on every loop packet. Each instrument is a card: the drawing, then under it the reading, a line saying what it means, and today’s high above its low.
- Temperature, dew point, feels-like and humidity dials draw today’s low-to-high as an arc inside the ticks. Feels like says how far it is from the air temperature.
- The wind compass points the dials’ red arm at the side the wind comes from, with a lighter, shorter needle for the strongest gust of the last ten minutes, and today’s prevailing direction as a short arc. Under it: “from WNW · gusting 14 mph from W”, today’s peak and the prevailing direction in words.
- The barometer draws the 3-hour trend as an arc, headed in the direction of travel, once the change is big enough to draw — about 1.3 hPa (0.04 inHg) — and says it in words (
trend.barometer.desc) either way. - UV and air quality wear their EPA category colors on the rim, and say the category: “High” at a UV index of 6, “Good” at an AQI of 38. EPA names the UV index rounded, so the page does too. The air quality dial runs to 500, the top of EPA’s Hazardous band.
- UV, solar radiation and rain rate draw today’s peak as an arc from the floor. Rain and rain-rate dials rescale themselves on a big day.
- The windrose is the NOAA banded kind, drawn from
day.windrose.bandedandday.windrose.calm. - UV, solar radiation and air quality (weewx-purple’s
pm2_5_aqi) gauges — and the feels-like dial where appTemp is not computed — hide themselves when the station doesn’t report the observation, and reappear if the field shows up in loop-data.txt.
The division of labor is the loopdata pattern in miniature: the .raw fields drive the geometry, .formatted fields supply each number and unit.label fields the unit beside it and the dial scales — so the panel follows this report’s units and formatting (metric or US, and its decimal point) like any other loopdata page. The numerals on the dials use the same decimal point. The panel scales with the window: four cards to a row, three below 1080 pixels, two below 800 and one below 540. Each drawing is a square stretched to its card, so its lines and words grow together (drawings cap at 480px), and the words under it grow with the card. Every gauge’s face, the windrose’s included, comes out the same size.
The fields the panel reads are declared in skins/LoopData/skin.conf, one group per gauge (see Declaring fields), and the page reads its own report’s entry in loop-data.txt — so it works whatever else the file carries, and a second copy of the skin under another report name gets its own entry.
The cards
Since 8.0 every gauge opens a card. Click or tap a gauge (the drawing is the keyboard target: Tab to it and press Enter) and a card opens over the panel — a full-screen sheet on a phone — with the dial and its lines at the left and, beside them, what the reading means and where it sits. The card follows the station like the panel does: everything on it is rewritten on every packet while it is open, from the same loop-data.txt poll. The ‹ › buttons in its head, or the arrow keys, step through the gauges; Escape, the × or a click outside closes it.
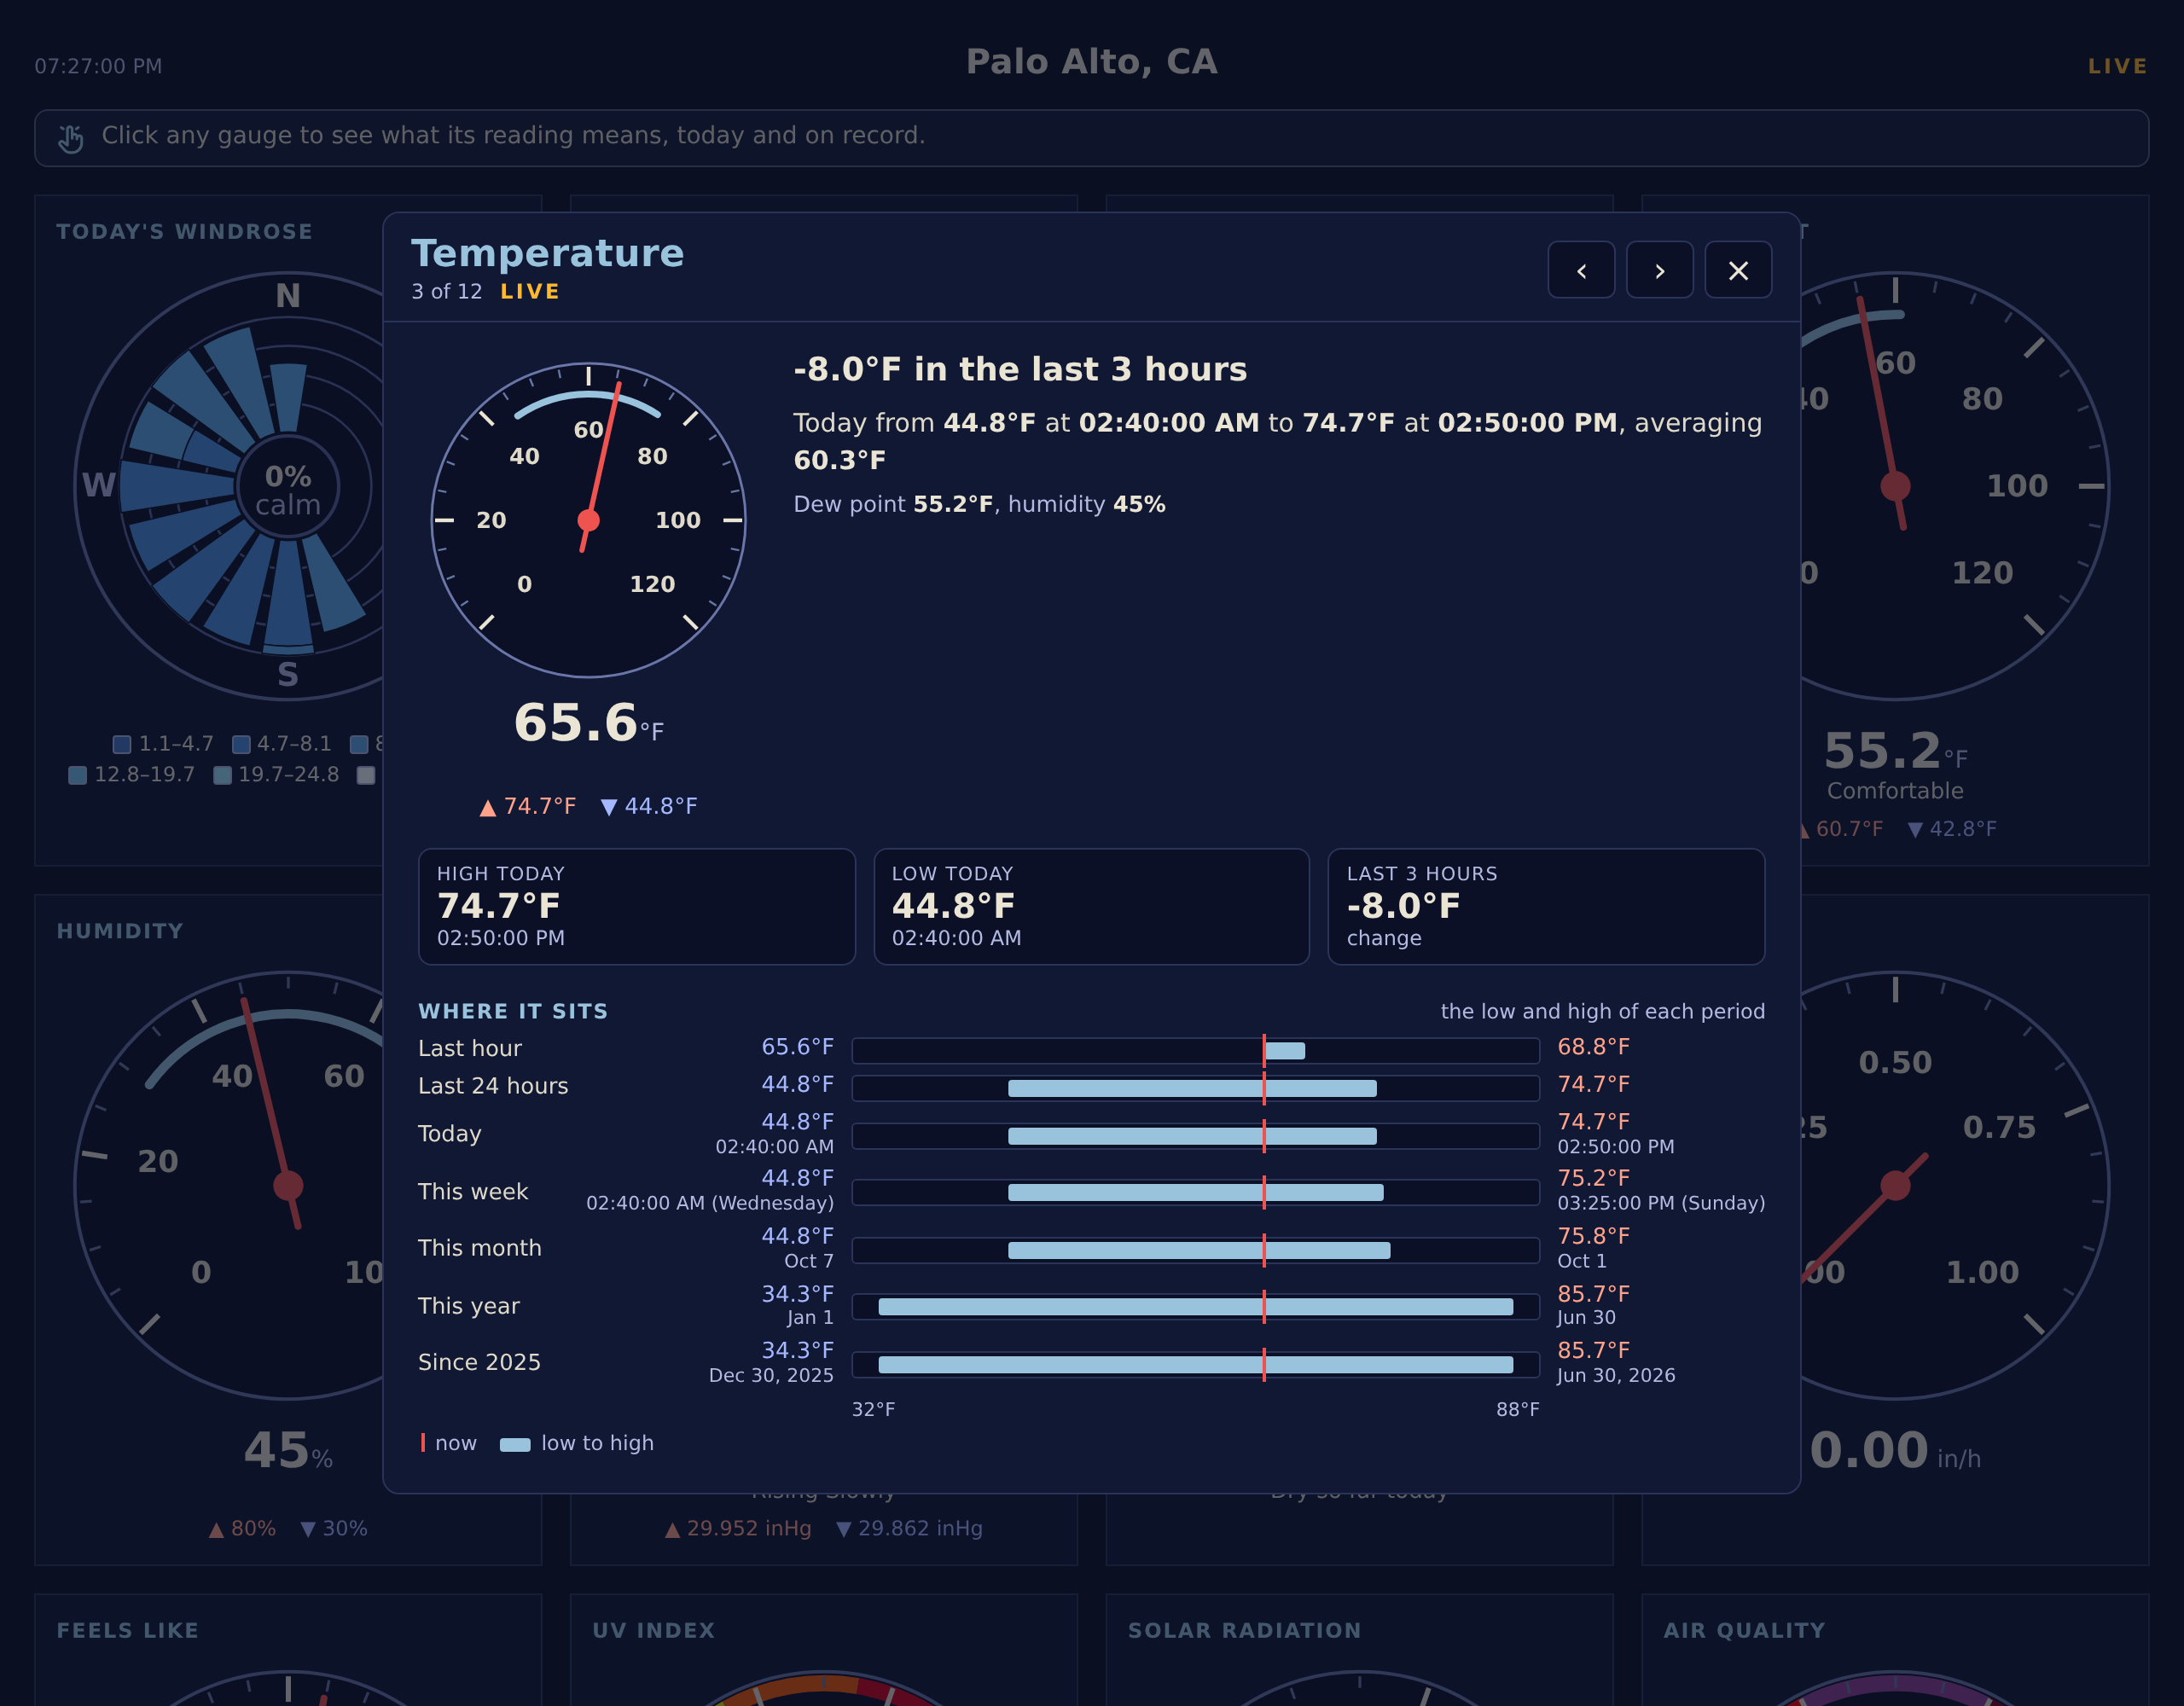
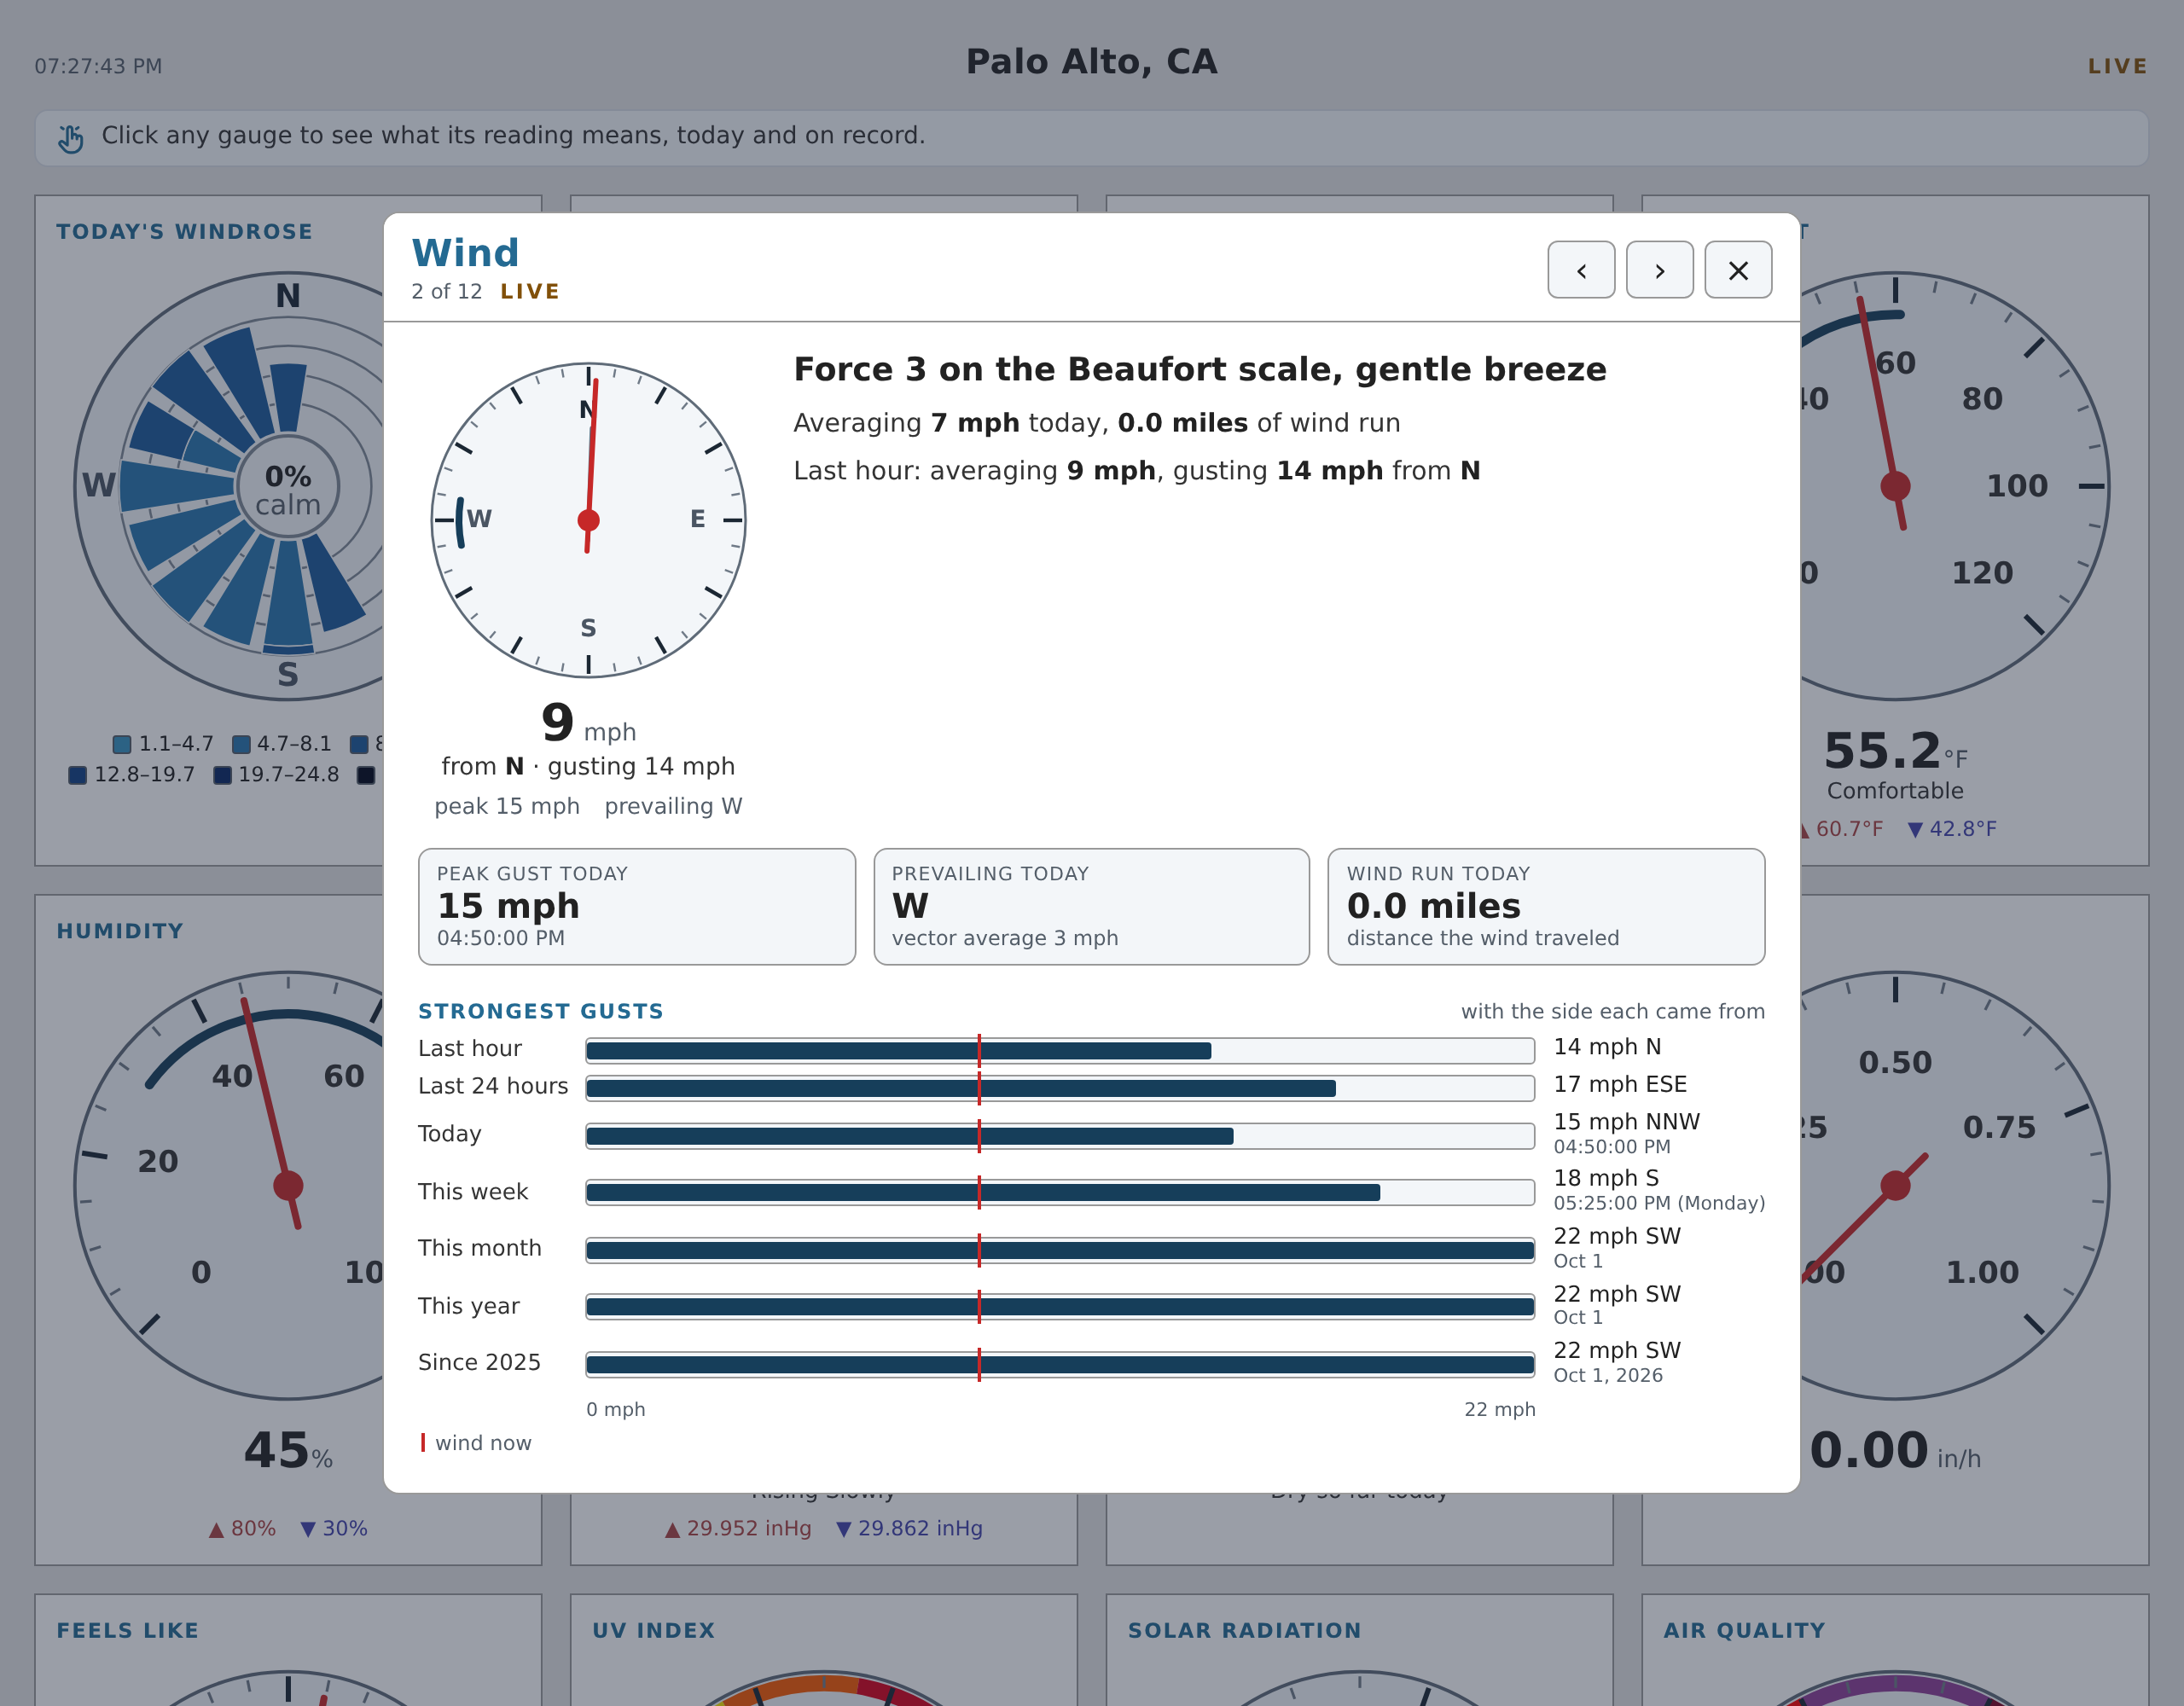
Each card is the same four things:
- A sentence that says the one thing the gauge means now: the change over the report’s trend window, the Beaufort force and its name, the dew point in words (dry, comfortable, sticky, muggy, oppressive), the sun’s altitude and when it sets (the altitude on WeeWX 5.0 and later; at high latitudes, that the sun does not set or does not rise today, or that civil twilight lasts all night, and the Sun up tile reads “all day” or “not today”), the AMS Glossary’s word for how hard it is raining. A fine-print line explains the measure once.
- Three tiles: today’s high and low with their times, and the change over the trend window — or, where those do not apply, the peak, the wind run, the rain year.
- The ladder: one row per period — the last hour, the last 24 hours, today, this week, this month, this year and all time — each a bar from the period’s low to its high on one axis, with the reading now drawn as a line through every row and the time or date of each extreme under it. The all-time row is the station’s records, with their dates, and is labeled by the year the archive begins. For a peak-only measure (UV, solar radiation, rain rate, the strongest gusts, rain by period) every bar runs from zero, and the UV and air quality bars wear EPA’s category colors.
- One more section where there is one: the windrose card draws the rose for this hour, today, this week, this month and this year; the UV and air quality cards show EPA’s scale with the reading’s row marked. The air quality card’s today tiles and its ladder rank each period’s highest (and today’s lowest) PM2.5, which is archived, and show it as the index weewx-purple computes for it; the index itself is an xtype, computed per packet and never archived, so loopdata refuses its aggregates for every period, today included. Only the reading now uses the index in the packet.
On a phone the card is a full-screen sheet:
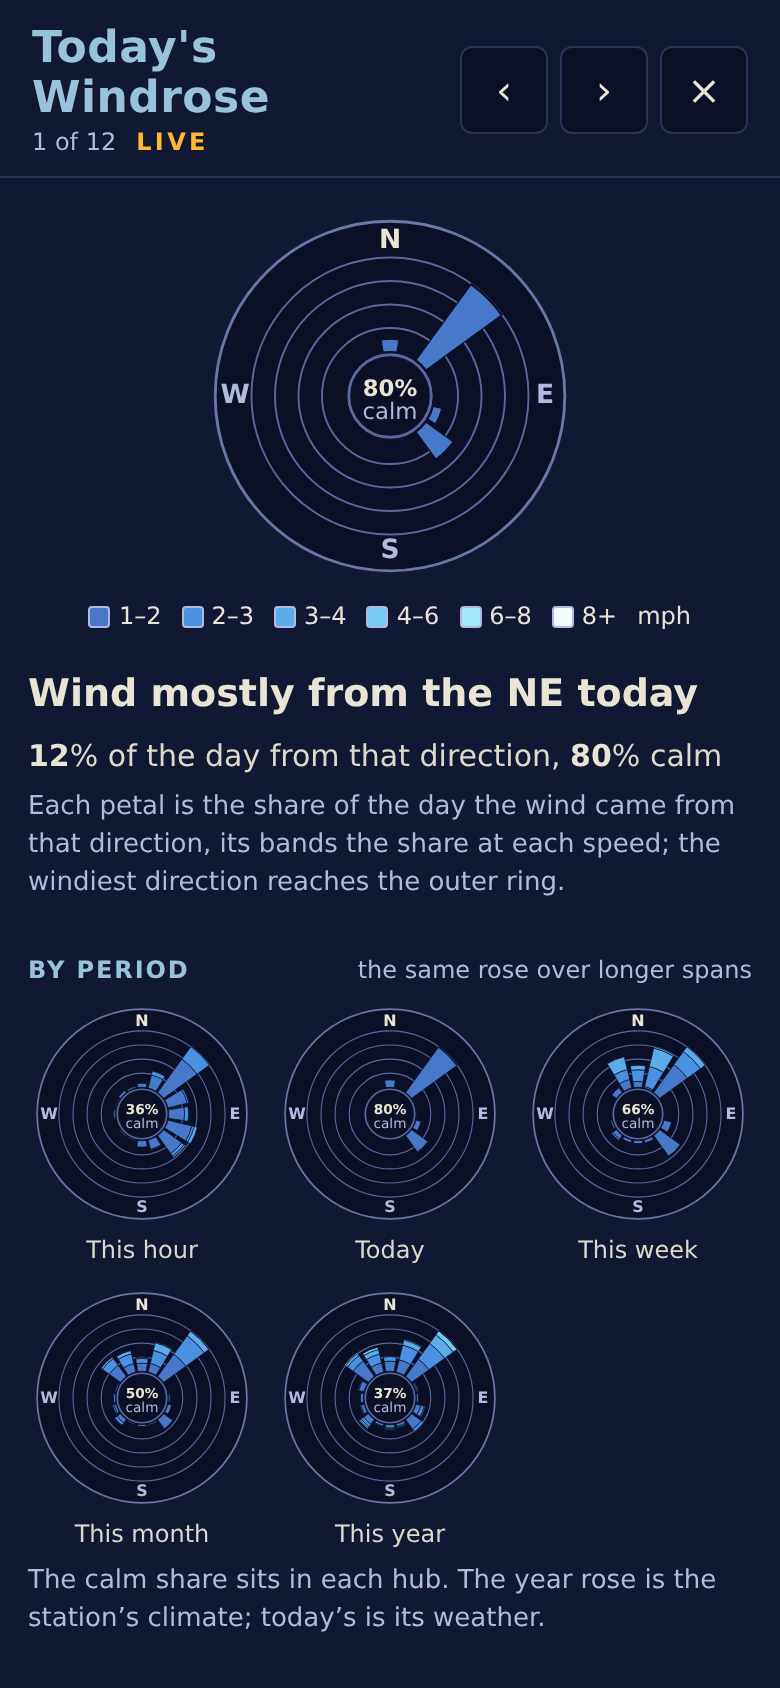
Day and week times on a card render through the report’s own [Units][TimeFormats], as the panel’s do; the month, year and all-time extremes carry a date, in the two forms the skin declares. All of it is translated in the eight shipped languages, by the same mechanism as the panel (see Translations); the card strings arrived with 8.0 and have not yet been reviewed by native speakers.
The cards cost the LoopData service something: each period a card ranks a reading against is an accumulator, and the rolling 24-hour windows keep every packet of the last day — about 10 MB each at two-second packets, some 80 MB for the nine observations the cards rank. The fields, one _card group per card, are listed below; a station that does not want the cost can delete a group from the declaration (in a copy of the report’s stanza in weewx.conf, since skin.conf is replaced on upgrade), and the card then says what the fields that remain can say.
What each gauge reads
Gauge by gauge, in the order the page lays them out. A gauge whose formatted field is missing shows --; one whose .raw field is missing draws no needle, arc or petal.
| Gauge | Fields |
|---|---|
| Today’s Windrose | day.windrose.banded, day.windrose.calm (and the automatic windrose.bands) |
| Wind | current.windSpeed.formatted, current.windSpeed.raw, current.windDir.raw, current.windDir.ordinal_compass, 10m.windGust.max, 10m.windGust.max.raw, 10m.wind.gustdir.raw, 10m.wind.gustdir.ordinal_compass, day.wind.max, day.wind.max.raw, day.wind.vecdir.raw, day.wind.vecdir.ordinal_compass |
| Temperature | current.outTemp.formatted, current.outTemp.raw, day.outTemp.min.raw, day.outTemp.max.raw, day.outTemp.min.formatted, day.outTemp.max.formatted |
| Dew Point | current.dewpoint.formatted, current.dewpoint.raw, day.dewpoint.min.raw, day.dewpoint.max.raw, day.dewpoint.min.formatted, day.dewpoint.max.formatted |
| Humidity | current.outHumidity.formatted, current.outHumidity.raw, day.outHumidity.min.raw, day.outHumidity.max.raw, day.outHumidity.min.formatted, day.outHumidity.max.formatted |
| Barometer | current.barometer.formatted, current.barometer.raw, trend.barometer.raw, trend.barometer.desc, day.barometer.min.formatted, day.barometer.max.formatted |
| Rain | day.rain.sum.formatted, day.rain.sum.raw, current.rainRate, current.rainRate.raw |
| Rain Rate | current.rainRate.formatted, current.rainRate.raw, day.rainRate.max, day.rainRate.max.raw |
| Feels Like | current.appTemp.formatted, current.appTemp.raw, day.appTemp.min.raw, day.appTemp.max.raw, day.appTemp.min.formatted, day.appTemp.max.formatted |
| UV Index | current.UV.formatted, current.UV.raw, day.UV.max, day.UV.max.raw |
| Solar Radiation | current.radiation.formatted, current.radiation.raw, day.radiation.max, day.radiation.max.raw |
| Air Quality | current.pm2_5, current.pm2_5_aqi.raw, current.pm2_5_aqi.formatted |
| Today’s Windrose card | hour.windrose.banded, hour.windrose.calm, week.windrose.banded, week.windrose.calm, month.windrose.banded, month.windrose.calm, year.windrose.banded, year.windrose.calm |
| Wind card | day.windSpeed.avg, day.windrun.sum, day.wind.vecavg, day.wind.maxtime, day.wind.gustdir.ordinal_compass, 1h.windSpeed.avg, 1h.windGust.max, 1h.windGust.max.raw, 1h.wind.gustdir.ordinal_compass, 24h.windGust.max, 24h.windGust.max.raw, 24h.wind.gustdir.ordinal_compass, week.wind.max, week.wind.max.raw, week.wind.gustdir.ordinal_compass, week.wind.maxtime, month.wind.max, month.wind.max.raw, month.wind.gustdir.ordinal_compass, month.wind.maxtime.format("%b %-d"), year.wind.max, year.wind.max.raw, year.wind.gustdir.ordinal_compass, year.wind.maxtime.format("%b %-d"), alltime.wind.max, alltime.wind.max.raw, alltime.wind.gustdir.ordinal_compass, alltime.wind.maxtime.format("%b %-d, %Y"), alltime.start.format("%Y") |
| Temperature card | trend.outTemp.formatted, day.outTemp.avg.formatted, 1h.outTemp.min.raw, 1h.outTemp.min.formatted, 1h.outTemp.max.raw, 1h.outTemp.max.formatted, 24h.outTemp.min.raw, 24h.outTemp.min.formatted, 24h.outTemp.max.raw, 24h.outTemp.max.formatted, day.outTemp.min.raw, day.outTemp.min.formatted, day.outTemp.mintime, day.outTemp.max.raw, day.outTemp.max.formatted, day.outTemp.maxtime, week.outTemp.min.raw, week.outTemp.min.formatted, week.outTemp.mintime, week.outTemp.max.raw, week.outTemp.max.formatted, week.outTemp.maxtime, month.outTemp.min.raw, month.outTemp.min.formatted, month.outTemp.mintime.format("%b %-d"), month.outTemp.max.raw, month.outTemp.max.formatted, month.outTemp.maxtime.format("%b %-d"), year.outTemp.min.raw, year.outTemp.min.formatted, year.outTemp.mintime.format("%b %-d"), year.outTemp.max.raw, year.outTemp.max.formatted, year.outTemp.maxtime.format("%b %-d"), alltime.outTemp.min.raw, alltime.outTemp.min.formatted, alltime.outTemp.mintime.format("%b %-d, %Y"), alltime.outTemp.max.raw, alltime.outTemp.max.formatted, alltime.outTemp.maxtime.format("%b %-d, %Y") |
| Dew Point card | trend.dewpoint.formatted, 1h.dewpoint.min.raw, 1h.dewpoint.min.formatted, 1h.dewpoint.max.raw, 1h.dewpoint.max.formatted, 24h.dewpoint.min.raw, 24h.dewpoint.min.formatted, 24h.dewpoint.max.raw, 24h.dewpoint.max.formatted, day.dewpoint.min.raw, day.dewpoint.min.formatted, day.dewpoint.mintime, day.dewpoint.max.raw, day.dewpoint.max.formatted, day.dewpoint.maxtime, week.dewpoint.min.raw, week.dewpoint.min.formatted, week.dewpoint.mintime, week.dewpoint.max.raw, week.dewpoint.max.formatted, week.dewpoint.maxtime, month.dewpoint.min.raw, month.dewpoint.min.formatted, month.dewpoint.mintime.format("%b %-d"), month.dewpoint.max.raw, month.dewpoint.max.formatted, month.dewpoint.maxtime.format("%b %-d"), year.dewpoint.min.raw, year.dewpoint.min.formatted, year.dewpoint.mintime.format("%b %-d"), year.dewpoint.max.raw, year.dewpoint.max.formatted, year.dewpoint.maxtime.format("%b %-d"), alltime.dewpoint.min.raw, alltime.dewpoint.min.formatted, alltime.dewpoint.mintime.format("%b %-d, %Y"), alltime.dewpoint.max.raw, alltime.dewpoint.max.formatted, alltime.dewpoint.maxtime.format("%b %-d, %Y") |
| Humidity card | trend.outHumidity.formatted, 1h.outHumidity.min.raw, 1h.outHumidity.min.formatted, 1h.outHumidity.max.raw, 1h.outHumidity.max.formatted, 24h.outHumidity.min.raw, 24h.outHumidity.min.formatted, 24h.outHumidity.max.raw, 24h.outHumidity.max.formatted, day.outHumidity.min.raw, day.outHumidity.min.formatted, day.outHumidity.mintime, day.outHumidity.max.raw, day.outHumidity.max.formatted, day.outHumidity.maxtime, week.outHumidity.min.raw, week.outHumidity.min.formatted, week.outHumidity.mintime, week.outHumidity.max.raw, week.outHumidity.max.formatted, week.outHumidity.maxtime, month.outHumidity.min.raw, month.outHumidity.min.formatted, month.outHumidity.mintime.format("%b %-d"), month.outHumidity.max.raw, month.outHumidity.max.formatted, month.outHumidity.maxtime.format("%b %-d"), year.outHumidity.min.raw, year.outHumidity.min.formatted, year.outHumidity.mintime.format("%b %-d"), year.outHumidity.max.raw, year.outHumidity.max.formatted, year.outHumidity.maxtime.format("%b %-d"), alltime.outHumidity.min.raw, alltime.outHumidity.min.formatted, alltime.outHumidity.mintime.format("%b %-d, %Y"), alltime.outHumidity.max.raw, alltime.outHumidity.max.formatted, alltime.outHumidity.maxtime.format("%b %-d, %Y") |
| Barometer card | trend.barometer.formatted, 1h.barometer.min.raw, 1h.barometer.min.formatted, 1h.barometer.max.raw, 1h.barometer.max.formatted, 24h.barometer.min.raw, 24h.barometer.min.formatted, 24h.barometer.max.raw, 24h.barometer.max.formatted, day.barometer.min.raw, day.barometer.min.formatted, day.barometer.mintime, day.barometer.max.raw, day.barometer.max.formatted, day.barometer.maxtime, week.barometer.min.raw, week.barometer.min.formatted, week.barometer.mintime, week.barometer.max.raw, week.barometer.max.formatted, week.barometer.maxtime, month.barometer.min.raw, month.barometer.min.formatted, month.barometer.mintime.format("%b %-d"), month.barometer.max.raw, month.barometer.max.formatted, month.barometer.maxtime.format("%b %-d"), year.barometer.min.raw, year.barometer.min.formatted, year.barometer.mintime.format("%b %-d"), year.barometer.max.raw, year.barometer.max.formatted, year.barometer.maxtime.format("%b %-d"), alltime.barometer.min.raw, alltime.barometer.min.formatted, alltime.barometer.mintime.format("%b %-d, %Y"), alltime.barometer.max.raw, alltime.barometer.max.formatted, alltime.barometer.maxtime.format("%b %-d, %Y") |
| Rain card | 1h.rain.sum, 1h.rain.sum.raw, 24h.rain.sum, 24h.rain.sum.raw, day.rain.sum, week.rain.sum, week.rain.sum.raw, month.rain.sum, month.rain.sum.raw, year.rain.sum, year.rain.sum.raw, rainyear.rain.sum, rainyear.rain.sum.raw, rainyear.start.format("%b %-d"), alltime.rain.sum, alltime.start.format("%Y") |
| Rain Rate card | day.rainRate.maxtime, month.rainRate.max, month.rainRate.max.raw, month.rainRate.maxtime.format("%b %-d"), year.rainRate.max, year.rainRate.max.raw, year.rainRate.maxtime.format("%b %-d"), alltime.rainRate.max, alltime.rainRate.max.raw, alltime.rainRate.maxtime.format("%b %-d, %Y") |
| Feels Like card | trend.appTemp.formatted, 1h.appTemp.min.raw, 1h.appTemp.min.formatted, 1h.appTemp.max.raw, 1h.appTemp.max.formatted, 24h.appTemp.min.raw, 24h.appTemp.min.formatted, 24h.appTemp.max.raw, 24h.appTemp.max.formatted, day.appTemp.min.raw, day.appTemp.min.formatted, day.appTemp.mintime, day.appTemp.max.raw, day.appTemp.max.formatted, day.appTemp.maxtime, week.appTemp.min.raw, week.appTemp.min.formatted, week.appTemp.mintime, week.appTemp.max.raw, week.appTemp.max.formatted, week.appTemp.maxtime, month.appTemp.min.raw, month.appTemp.min.formatted, month.appTemp.mintime.format("%b %-d"), month.appTemp.max.raw, month.appTemp.max.formatted, month.appTemp.maxtime.format("%b %-d"), year.appTemp.min.raw, year.appTemp.min.formatted, year.appTemp.mintime.format("%b %-d"), year.appTemp.max.raw, year.appTemp.max.formatted, year.appTemp.maxtime.format("%b %-d"), alltime.appTemp.min.raw, alltime.appTemp.min.formatted, alltime.appTemp.mintime.format("%b %-d, %Y"), alltime.appTemp.max.raw, alltime.appTemp.max.formatted, alltime.appTemp.maxtime.format("%b %-d, %Y") |
| UV Index card | day.UV.maxtime, 1h.UV.avg.formatted, almanac.sun.altitude, almanac.sun.transit, almanac.sunrise, almanac.sunrise.raw, almanac.sunset, almanac.sunset.raw, almanac.sun.visible.long_form(), almanac.sun.visible.second.raw, week.UV.max, week.UV.max.raw, week.UV.maxtime, month.UV.max, month.UV.max.raw, month.UV.maxtime.format("%b %-d"), year.UV.max, year.UV.max.raw, year.UV.maxtime.format("%b %-d"), alltime.UV.max, alltime.UV.max.raw, alltime.UV.maxtime.format("%b %-d, %Y") |
| Solar Radiation card | day.radiation.maxtime, 1h.radiation.avg, almanac.sun.azimuth, almanac(horizon=-6).sun(use_center=1).set, almanac(horizon=-6).sun(use_center=1).set.raw, almanac.sun.visible_change.minute.raw, week.radiation.max, week.radiation.max.raw, week.radiation.maxtime, month.radiation.max, month.radiation.max.raw, month.radiation.maxtime.format("%b %-d"), year.radiation.max, year.radiation.max.raw, year.radiation.maxtime.format("%b %-d"), alltime.radiation.max, alltime.radiation.max.raw, alltime.radiation.maxtime.format("%b %-d, %Y") |
| Air Quality card | 1h.pm2_5.avg, 24h.pm2_5.avg, 24h.pm2_5.max.raw, day.pm2_5.min.raw, day.pm2_5.mintime, day.pm2_5.max.raw, day.pm2_5.maxtime, week.pm2_5.max.raw, week.pm2_5.maxtime, month.pm2_5.max.raw, month.pm2_5.maxtime.format("%b %-d"), year.pm2_5.max.raw, year.pm2_5.maxtime.format("%b %-d"), alltime.pm2_5.max.raw, alltime.pm2_5.maxtime.format("%b %-d, %Y") |
The card rows are the groups 8.0 added, one per card, on top of the gauge’s own; a card also reads its gauge’s fields. Each card’s page lines are the panel’s, copied.
current.dateTime.raw drives the timestamp and the LIVE indicator. unit.label.outTemp, unit.label.outHumidity, unit.label.barometer, unit.label.rain, unit.label.rainRate, unit.label.windSpeed and unit.label.radiation supply the unit beside each reading and pick the dial scales.
To turn the sample page off, set enable = false on [[LoopDataReport]] rather than deleting or renaming the section: a relative loop_data_dir is measured from its directory, and the installer would put the section back on the next upgrade anyway.
The declaration in skin.conf is overwritten by every upgrade, as the rest of the skin is. To add a field for a customization of your own, declare it under the report’s stanza in weewx.conf instead — see Adding to a declaration from weewx.conf.
Translations
As of 6.4 the page is translatable through WeeWX lang files, and eight translations ship (a ninth lang file, en.conf, is the English reference dictionary). lang = de on the report’s stanza selects German; the full list is in Translations. Two languages meet on a loopdata page — the page’s labels follow this report’s lang at generation time, the live values follow it on every packet — see Translations.
Skin options
In the skin’s [Extras]. Most of them have a value in skins/LoopData/skin.conf, which is replaced on every upgrade; a copy in the report’s weewx.conf stanza, which is not, overrides it. A fresh install now writes only page_update_pwd there as a live setting and leaves the rest commented out, so that the skin’s own value answers unless something else in weewx.conf supplies one. The two analytics options are the exception: neither file sets them, because their default is to be absent — see below. A station installed before that change has live copies of loop_data_file and expiration_time in weewx.conf, and those still win — edit them there:
loop_data_file— the URL the page polls for the json file (defaultloop-data.txt; relative values are relative to this report’sHTML_ROOT, and the defaultloop_data_dir = .writes the file beside this page).refresh_rate— seconds between polls (default2). Set it to your station’s loop frequency; polling faster than the file is rewritten just re-reads the same json. A0, a negative, or anything that is not a number, means the default.expiration_time— hours after which the page stops polling (default24), so abandoned browser tabs don’t poll forever. A click restarts it. Set it to0and the page never expires — the same thing?pageUpdate=buys a kiosk, without the URL. A negative, or anything that is not a number, means the default.theme— which theme the page wears:auto(the default),darkorlight. Anything else is treated asauto. See Themes below, which is also where to look if your page turned light when you upgraded.page_update_pwd— loading the page as?pageUpdate=<page_update_pwd>exempts it from expiration (for a kiosk display). Note the URL parameter ispageUpdate, while the option that sets its expected value ispage_update_pwd. Any characters work — spaces, quotes, accents — and the URL value is compared both as typed and percent-decoded, so a URL that already worked goes on working. Set the option empty and no URL exempts the page; it expires like any other. This password is visible to anyone reading the page source.googleAnalyticsId— a Google Analytics measurement id. Set it and the page loads Google’sgtag.jsand reports to that id; leave it empty, or leave the option out, and the page loads nothing and reports nothing. Neither the skin nor a fresh install sets it — the installer writes a commented-out example to fill in. (Installs from 6.11.3 through 7.0 have it inweewx.confas an empty value, which also reports nothing.)analytics_host— report only when the page is served from this hostname, which keeps a copy you are testing locally out of your figures. Empty, or absent, means report from wherever the page is served. It does nothing unlessgoogleAnalyticsIdis set.
Before 6.11.3 both options were tested for presence rather than for a value. Because the installer wrote them present but empty, a default install fetched gtag.js with an empty id on every page view, and anyone who set an id but left analytics_host empty had the page compare its hostname against "" — never true — and report nothing. Both now test the value, as described above.
Themes
The page ships two: dark, deep dials on navy cards, and light, pale dials on white cards. In both, each gauge has one red arm, as an analog gauge does. theme in the report’s [Extras] chooses between them.
auto is the default, and it follows the viewer, not the station. The browser reports whatever the person looking at the page has set on their own computer — the macOS or Windows appearance setting, Android or iOS night mode, often on a schedule that turns over at sunset — and the page follows it. Two people looking at the same page at the same moment can see different themes, and a viewer who changes the setting while the page is open sees it change under them without a reload.
If your page turned light when you upgraded
That is auto doing its job, and one line puts it back. A browser with no preference set reports light, not “no preference” — that value was removed from the standard — so a machine where nobody has chosen a theme gets the light page. To pin the dark page for everyone regardless of their setting, put this in the report’s stanza in weewx.conf:
[StdReport]
    [[LoopDataReport]]
        [[[Extras]]]
            theme = dark
A fresh install writes that line commented out, as #theme = auto; uncomment it and change the value. An install from before this release has no such line at all — add it. Then restart weewxd. WeeWX’s report engine reads weewx.conf once, at startup, and re-reads only skin.conf and the language file on each report cycle — so a running weewxd will not notice this edit, however long you wait. (weectl report run does read it fresh, which is why the change shows there.) Your browser may also need a reload past its cache.
theme = light pins the light page the same way, for a station that wants it regardless of who is looking.
Retuning the colors
The palette is a set of CSS custom properties at the top of index.html.tmpl, and that is the only place the colors are written: the instruments are SVG whose every line and fill is a css class, so the javascript names no color at all. The dark values sit on :root and the light ones are named --light-* beside them, applied by a prefers-color-scheme media query and by the [data-theme] attribute the theme option sets. The one set that is the same in both themes is the UV and air quality rims, which are EPA’s own colors.
The shipped numbers were measured, not picked: every color clears the surface it is drawn on — 4.5:1 for text, 3:1 for a needle, arc or tick — and the six windrose shades (--rose1 to --rose6) step evenly from the calmest band to the windiest against their own theme. If you retune, keep those relationships or the dials get harder to read at the size they are actually drawn. Note also that a skin edit is replaced on the next upgrade — weewx.conf is not.
Files to crib from
index.html.tmpl— the page skeleton: a card per gauge with an empty slot for its drawing and one for its reading, the palette, and the styles that dress the drawings. It renders no readings itself; every value on the page arrives by poll.realtime_updater.inc— the polling javascript: the fetch loop, the LIVE/OFFLINE/NO DATA/BAD DATA indicator, the expiration timer, and the SVG drawing of the dials, the compass and the windrose. It writes class names only, and rewrites a drawing only when it changed.gauge_cards.inc— the cards (8.0): one dialog, filled per gauge from the same record the panel just drew, and the ladder, the tiles and the sentences that fill it. It leans on the updater’s helpers and wraps itsupdateGaugesso an open card redraws after the panel does.
The six --rose shades are stops on a curve rather than one color per band: the windrose samples them, with css color-mix, for however many speed bands your windrose_bands produces, so the calmest band is always the first stop and the windiest always the last, and six bands get the six stops exactly.
Building a live page walks through the same pattern for your own skin.