WeeWX LoopData — make your skins come alive
View on GitHub Download weewx-loopdata.zip Report an issue
With LoopData, the tags in your WeeWX reports can be updated on every LOOP packet — typically every few seconds — instead of waiting for the next archive interval and page reload. This works for nearly every tag you would use in a report: current observations, trends, aggregates over hours, days, weeks, months, years and rolling windows — including almanac tags, station tags and unit labels.
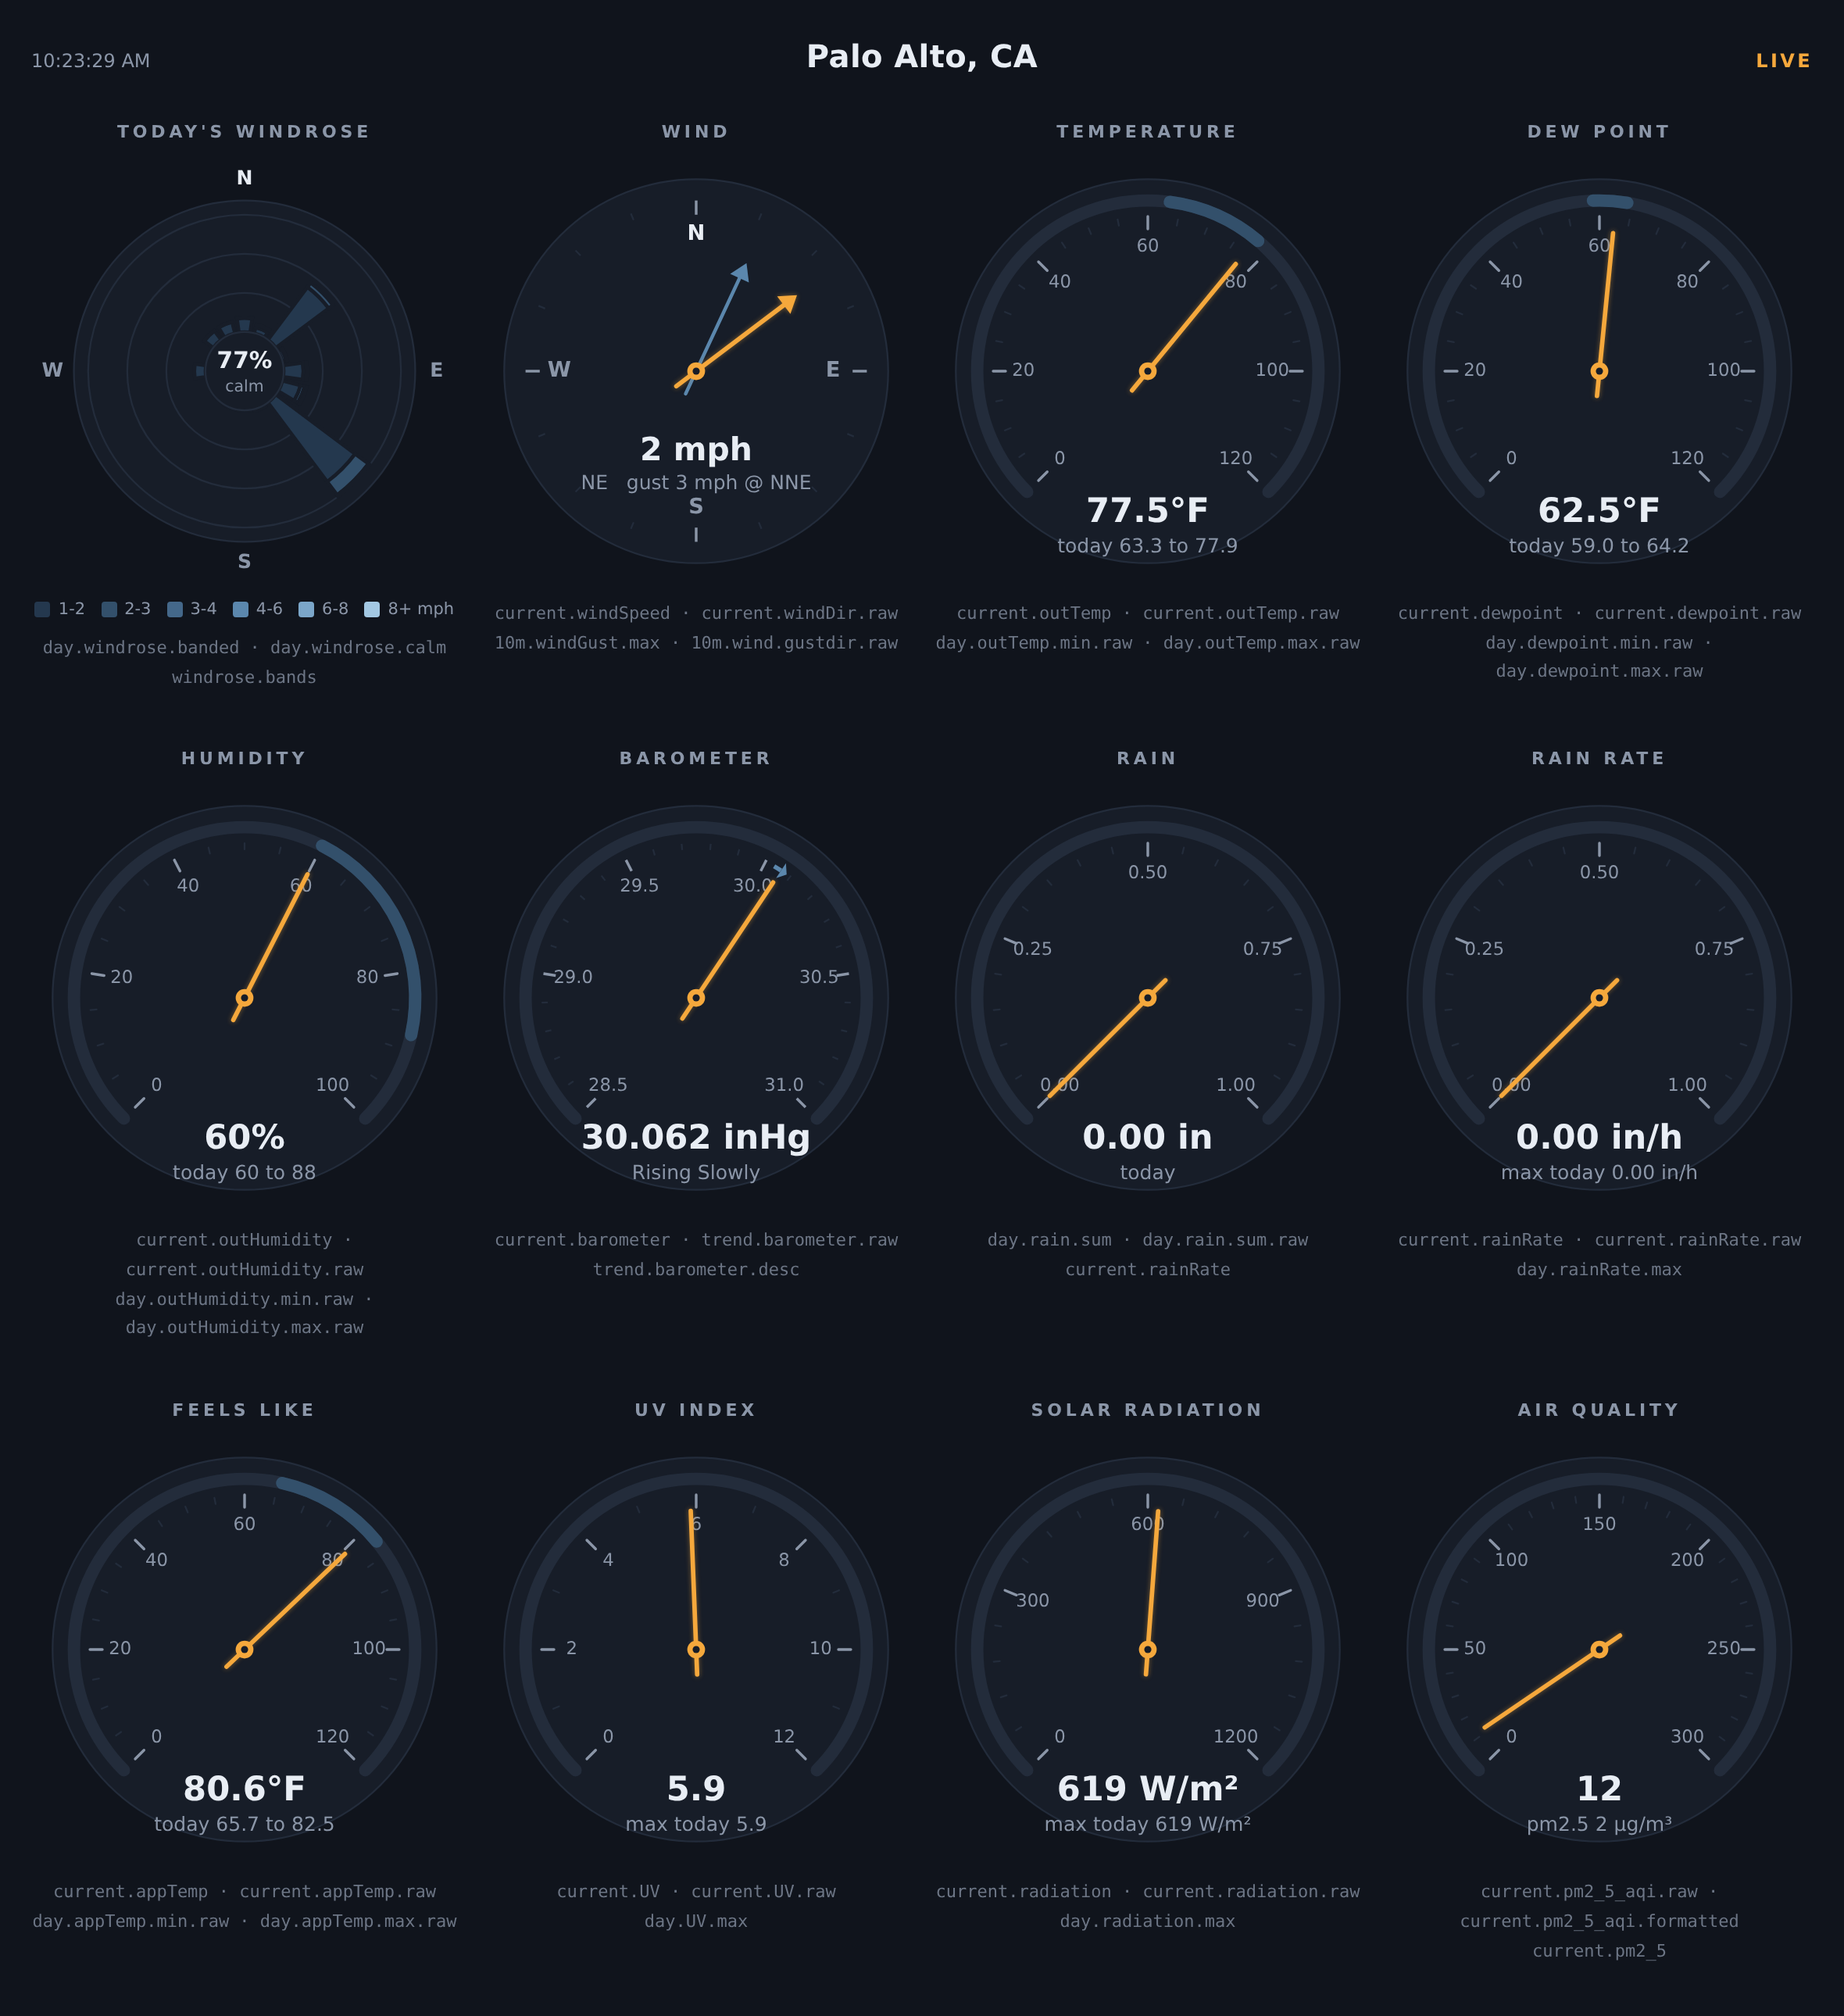
This is the sample report included with the extension — a NOAA-style windrose and eleven gauges, drawn as SVG by a few hundred lines of dependency-free javascript. Every needle, petal and readout on this page redraws on every loop packet, and gauges for sensors a station does not have (UV, solar radiation, air quality) hide themselves automatically. Since 8.0 a click or a tap on any gauge opens a card that says what the reading means and where it sits against the last hour, the last day, this week, this month, this year and the station’s records:
Requirements: Python 3.7 or later and WeeWX 4.6 or later. No third-party Python packages.
The whole idea in one example
Say your report template shows a current condition, a daily aggregate and an almanac time:
Temperature: $current.outTemp
High today: $day.outTemp.max
Sunset: $almanac.sunset
Declare those same tags — with the $ removed — in your skin’s skin.conf:
[LoopData]
    [[fields]]
        readings = current.outTemp, day.outTemp.max, almanac.sunset
Now, on every loop packet, LoopData writes a json file, loop-data.txt, with an entry for your report holding those tags as its keys — and every value already unit-converted and formatted exactly as your report would render it:
{"MyReport": {"current.outTemp": "79.2°F", "day.outTemp.max": "85.1°F", "almanac.sunset": "20:32"}}
Finally, in the template, wrap each tag in an element whose id is the tag, and add a few lines of javascript to fill those elements from loop-data.txt:
Temperature: <span id="current.outTemp">$current.outTemp</span><br/>
High today: <span id="day.outTemp.max">$day.outTemp.max</span><br/>
Sunset: <span id="almanac.sunset">$almanac.sunset</span>

#import json
<script>
  async function updateLoopData() {
    const response = await fetch('loop-data.txt', {cache: 'no-store'});
    const data = (await response.json())[$json.dumps($REPORT_NAME)];
    for (const key in data) {
      const element = document.getElementById(key);
      if (element) element.innerHTML = data[key];
    }
  }
  setInterval(updateLoopData, 2000);  // match your loop frequency
</script>
The page loads showing the values Cheetah rendered at report time, then comes alive: every wrapped tag updates as fast as your station reports. That is all there is to it.
Where to go next
- Installation — install the extension and check that it is running.
- Upgrading — what an existing install must change, by version.
- Configuration — every
[LoopData]option in weewx.conf. - Declaring fields — how a report declares the fields it needs, and is served in its own units and language; and how a consumer that is not a report — a shell script, an SNMP extension, a monitoring check — gets its fields, through the
ScriptDatareport. - Building a live page — the recipe for using LoopData in your own skin, with production-grade javascript, and what loop-data.txt guarantees.
- Field reference — the full grammar: periods, aggregates, unit overrides,
round(n)and format specs. - The live windrose — the
windroseobservation type and how to tune its speed bands for your site. - Almanac fields — sunrise, moon phase, planet positions and more, computed live.
- Station fields —
$stationtags as live fields, including a restart-correct uptime. - The sample skin — the instrument panel that ships with the extension.
- Translations — the sample report in your language (German, French, Danish, Dutch, Spanish, Italian, Norwegian and Swedish ship), and which report’s language governs which string.
- Syncing to a remote server — rsync configuration and troubleshooting.
- How LoopData works — architecture and performance.
- Troubleshooting — symptoms and fixes.
See it in action
- The “Tempestas” skin at www.paloaltoweather.com is loopdata-driven throughout, including its celestial tabs: weewx-celestial’s Geocentric panel — every body placed by compass bearing and distance, the moon at its true phase, odometer distance readouts ticking between loop packets — is drawn entirely from loopdata almanac fields.
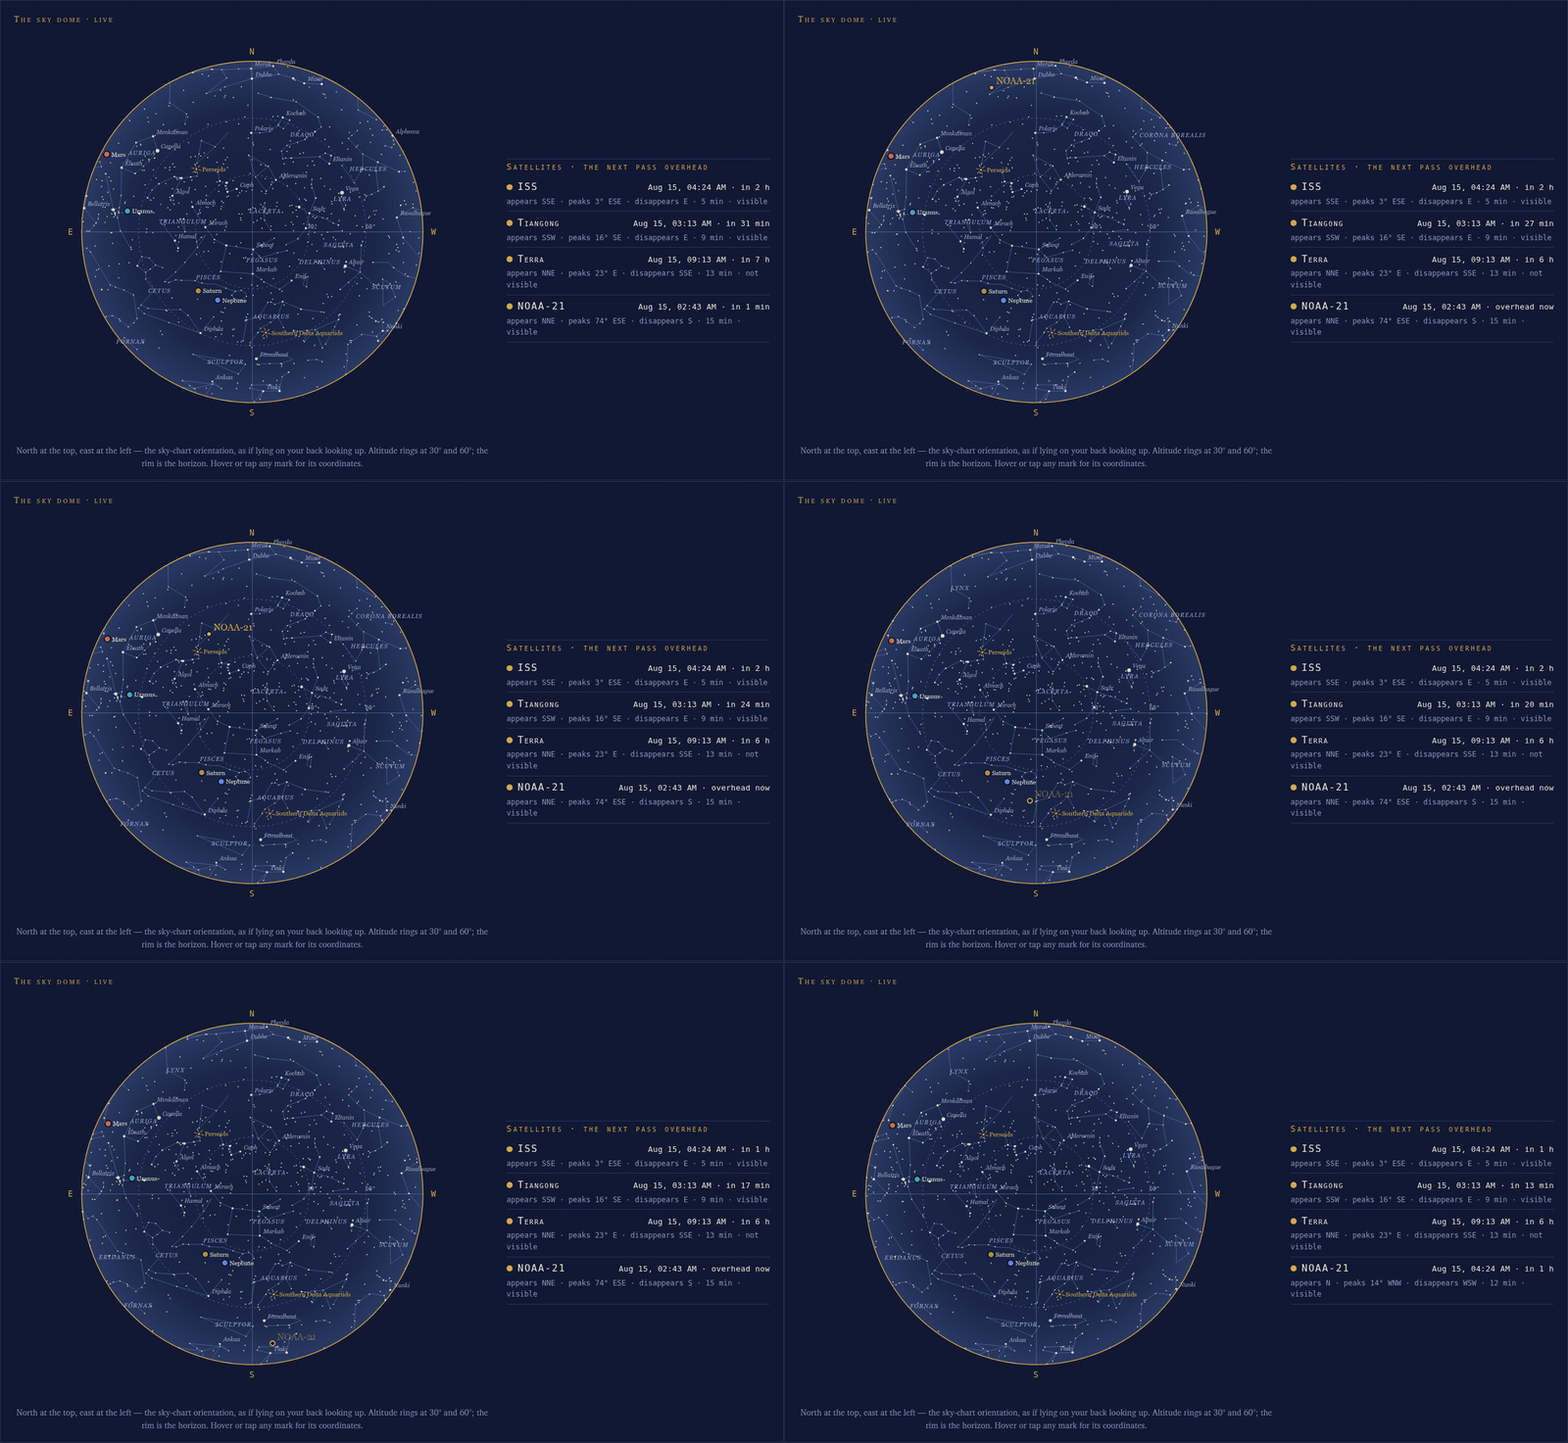
Below, loopdata is driving weewx-celestial’s satellite pages, captured live from the running page (2-second frames played at about 30× speed): NOAA-21 crosses the Palo Alto sky before dawn on August 15, 2026 — 02:43→02:58 PDT, peaking 74° in the east-southeast. The dome places the satellite from per-packet almanac position fields, and the roster rows are next_pass fields. The satellite rises sunlit at full brass, and mid-pass the dome’s marker flips to a hollow ring as NOAA-21 enters Earth’s shadow; the roster’s NOAA-21 row reads “overhead now” for exactly as long as the pass lasts, then rolls to the following pass the moment this one ends.
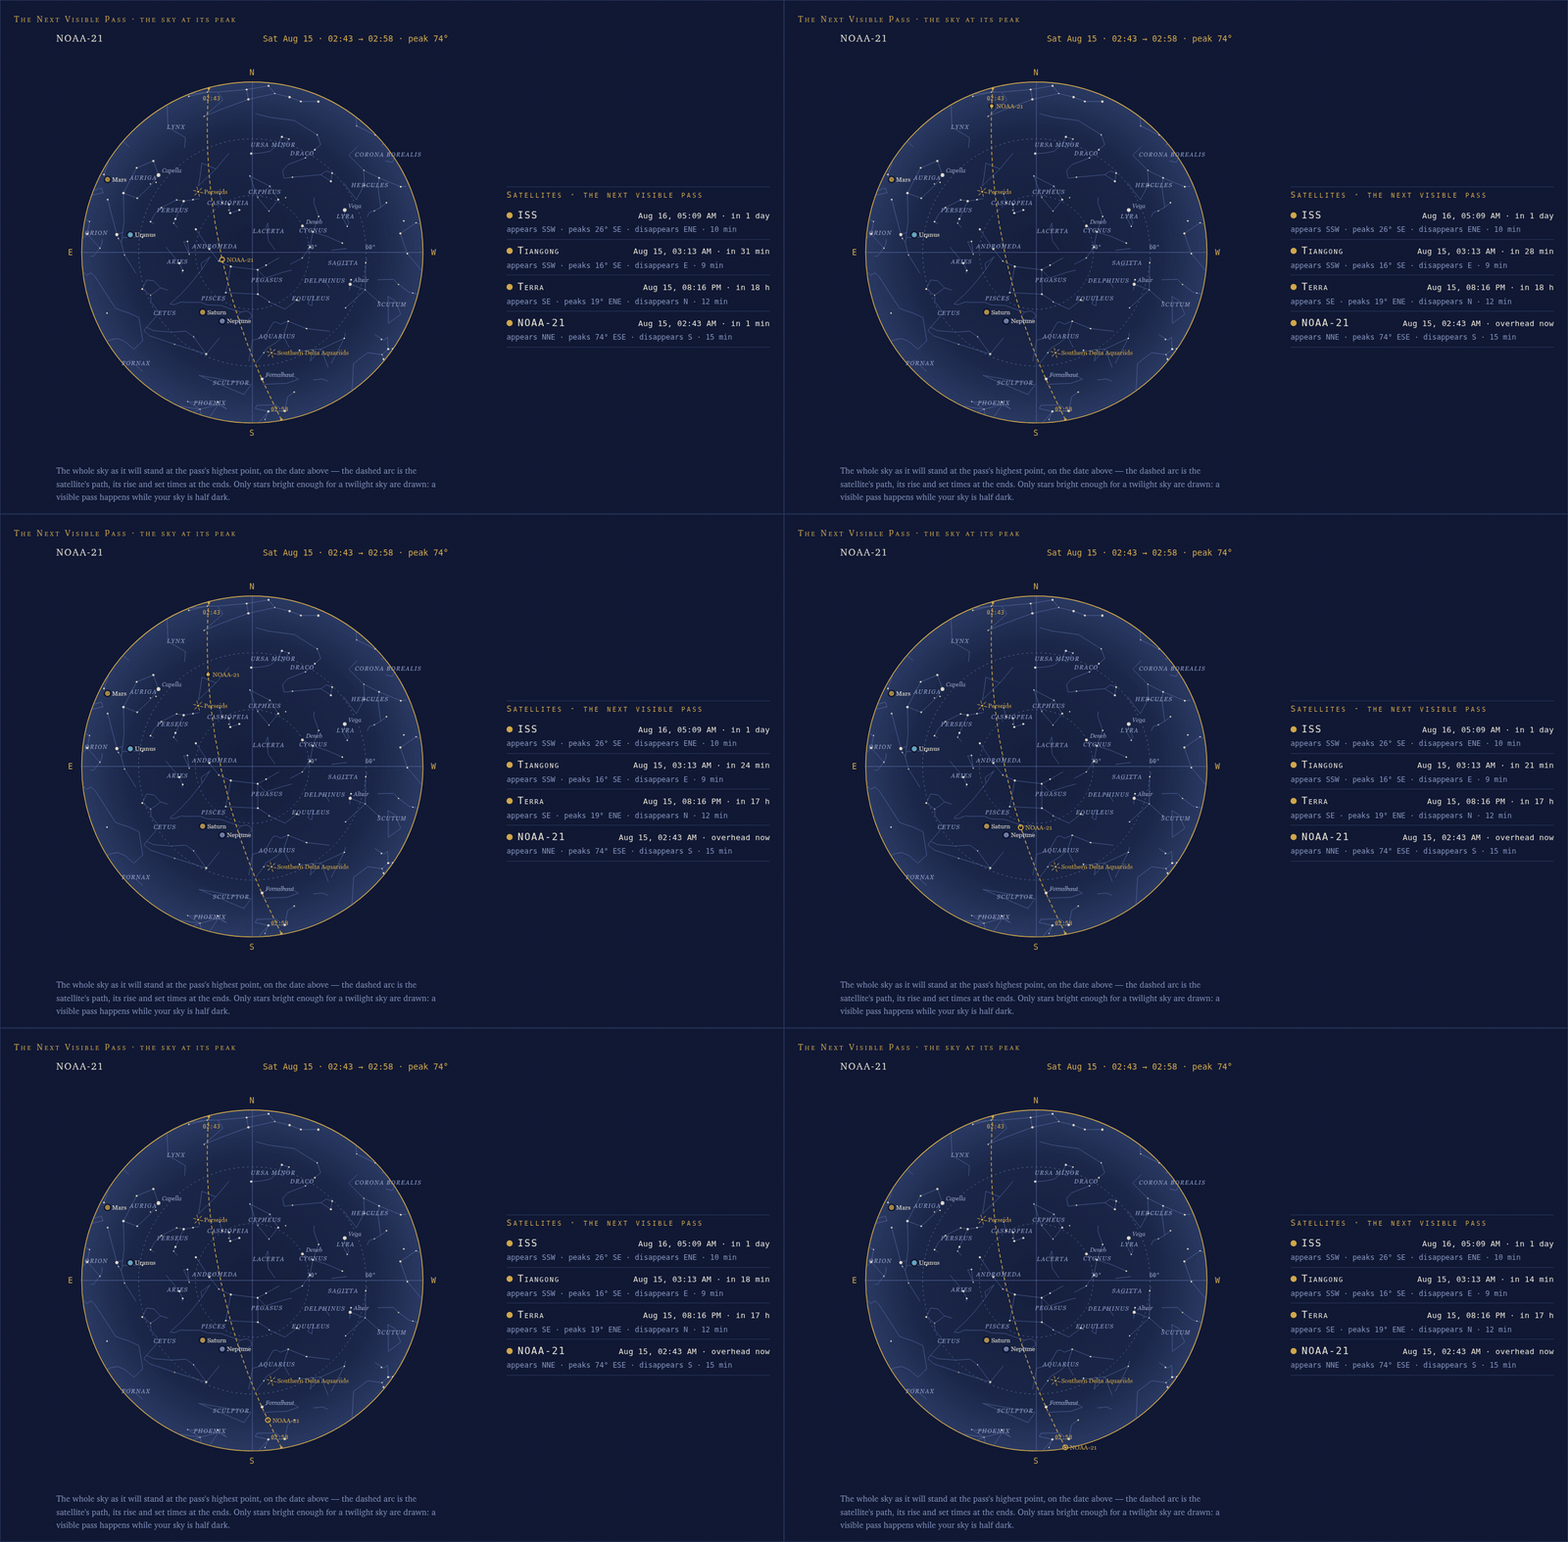
The Next Visible Pass panel draws the whole pass at once — the dashed arc is the satellite’s path, with its rise and set times at the ends — while the sweep mark rides the arc to show where along that path the satellite is right now. The sweep mark carries the satellite’s live sunlit state as well, so it hollows out at the same instant the dome’s marker does.
This extension was inspired by Gary Roderick’s weewx-realtime_gauge_data extension (its GitHub repository is no longer available).
About this manual
This manual describes loopdata 7.0 and later. What changed in each version is on the releases page; what an existing install must change is on Upgrading.
Licensing
weewx-loopdata is licensed under the GNU Public License v3.