Reading the page
weewx-celestial manual · weewx-celestial on GitHub · Report an issue
This page is the key to the picture: what every mark, color and phrase on the Celestial page means. Nothing here needs configuring — it is all reading.
The page runs top to bottom: a header, the countdown row, then three panels — the Geocentric, the sky dome, and the Next Visible Pass. A panel whose almanac cannot serve it shows an install hint in its place rather than disappearing, and the page never fails to generate because a value is missing; see the almanac tiers.
A panel may also carry a line about its own configuration rather than its almanac — that its live fields are not declared, or that the declaration is out of date and wants the installer re-run. A panel in that state first-paints correctly and then never moves, so the line is there to say why; each one names what to do, and Troubleshooting has them all.
The header, and the badge that tells the truth
The header carries the page title, the station’s coordinates, and the moment of the last loop packet — or, before any packet has arrived, the instant the page was generated for. That is the page’s own clock, and it is the station’s; see Whose time it is. A status badge follows it. The badge is the first thing to look at when something seems wrong, because it reports the feed’s actual state rather than a hopeful one:
| Badge | What it means |
|---|---|
LIVE | The record on show is less than 6 seconds old. Everything on the page is current. |
12s ago | The record on show is more than 6 seconds old; the number is its age. Brief gaps are normal; a number that climbs means the feed has stopped — including the case where the web server goes on serving the same file loopdata stopped writing. A small number that stands rather than climbs is the feed arriving that late: the packets keep coming, but each one reaches the web server seconds after it was written; see The badge reads a few seconds and never LIVE. |
NO DATA (HTTP 404) — check loop_data_file | The page fetched the loop-data file and the web server said it isn’t there. This is a wiring problem, not an astronomy problem — see loop_data_file. |
BAD DATA — check loop_data_file | The file was served but could not be parsed as the expected json — or it parsed but carried no entry for this report (the browser console says no "CelestialReport" entry in loop_data_file: a weewx-loopdata older than 7.0, or one not restarted since the install), or its entry carried no current.dateTime.raw, which the page needs to place anything at all. |
OFFLINE | The fetch itself failed — no network, or the web server is down. |
CLICK-ME | The page stopped polling after expiration_time hours. Click it to resume. |
The age is measured from the record’s own timestamp to the clock of the machine that served it — never to your browser’s, which may be set to anything at all. It therefore counts the time the loop-data file takes to reach the web server, which on a station that publishes to a remote host is not always under six seconds. See Whose time it is.
While the feed is stale the readouts freeze rather than drift: the page extrapolates motion for at most 120 seconds past the newest packet, then holds. The countdown chips, the rosters’ pass countdowns and the “updated” stamp do not extrapolate at all: they stand at the last packet’s values from the moment the feed stops, because the clock they read stops with it. A frozen page is telling you the truth about a dead feed.
Countdown central
The chip row under the header answers “what’s next, and how long have I got?”. Each chip carries a label, a counting value, and — for events more than a day out — the date it lands on. The chips count on the loop packets — every two seconds on most stations — because the clock they count on is the packet’s own.
Four chips are always on when their fields are available:
- The soonest visible satellite pass, across every configured satellite:
appears in 00:41:12, thenoverhead nowfor the duration of the pass, thenjust setin the moment before the feed rolls forward to the next one. - Sunset or sunrise, whichever comes next. The chip flips by itself at the event.
- The next meteor shower’s peak, under the shower’s name, with the moon’s illumination at the peak beside it — the fact that decides whether a shower is worth setting an alarm for.
- Astronomical darkness:
darkness beginsat the −18° sunset,darkness endsat the −18° sunrise, whichever is next.
Four more are windowed guests: they appear only within about 30 days of their event, which is when a countdown starts to mean something. Those are the next equinox or solstice (named by the season it begins — “autumn begins”), Earth’s perihelion or aphelion, the next supermoon, and the next eclipse visible from your station. Each configured comet also contributes a perihelion chip on the same 30-day rule.
A countdown shows the two largest units that matter: 22 d 19 h a day or more out, with the event’s date beside it; 9 h 35 m inside a day; 35 m inside an hour; 45 s in the last minute.
A chip you never see is not a fault. A chip is hidden when its field is missing from the feed, when the almanac cannot compute it, or — for the windowed guests — when the event is still more than 30 days out. See the declared fields.
The two plates
The page comes in two: the night plate it ships with, and a paper-atlas plate for a light page (theme = light, or auto to follow the sun — see Dark, light and auto). Nothing below reads differently on the light one; the whole page changes together, the sky dome and Next Visible Pass chart included, and no panel is left on the night plate inside a light page.
There is a picture of the light plate on the Configuration page.
One thing is drawn differently rather than merely recolored. The sun, the moon and Venus are pale by identity, and a pale mark on white paper is barely a mark — so on the light plate each of the three takes a darker edge in its own color: the outline of its dot, of its dashed below-horizon shape, of its motion trail, and a ring inside its roster chip. It is the same body, wearing the same color, with an edge on it.
On a phone, a different drawing
Open the page on a phone and the three charts are not the desktop’s charts shrunk down — they are drawn again, at phone size. Since 9.6 each one is generated twice and the page shows whichever fits the width the chart is actually rendered at.
What you gain is type you can read: every label on a phone clears 11 pixels, where the desktop drawing squeezed into a phone’s width put them between 5 and 7. What you give up is some detail, which is what makes the room: the dome carries stars to magnitude 4.0 instead of 5.0 and names only the brightest, a constellation is named only where its figure is wide enough to hold the name, and the Geocentric’s distance rings are labeled every other decade. Every body, satellite, comet and radiant is drawn and named on both.
Turning the phone switches between them immediately — both drawings are already on the page, so nothing is fetched and nothing is recomputed — and the live layer keeps both current, so the one that appears is already showing the right sky rather than catching up.
The Geocentric
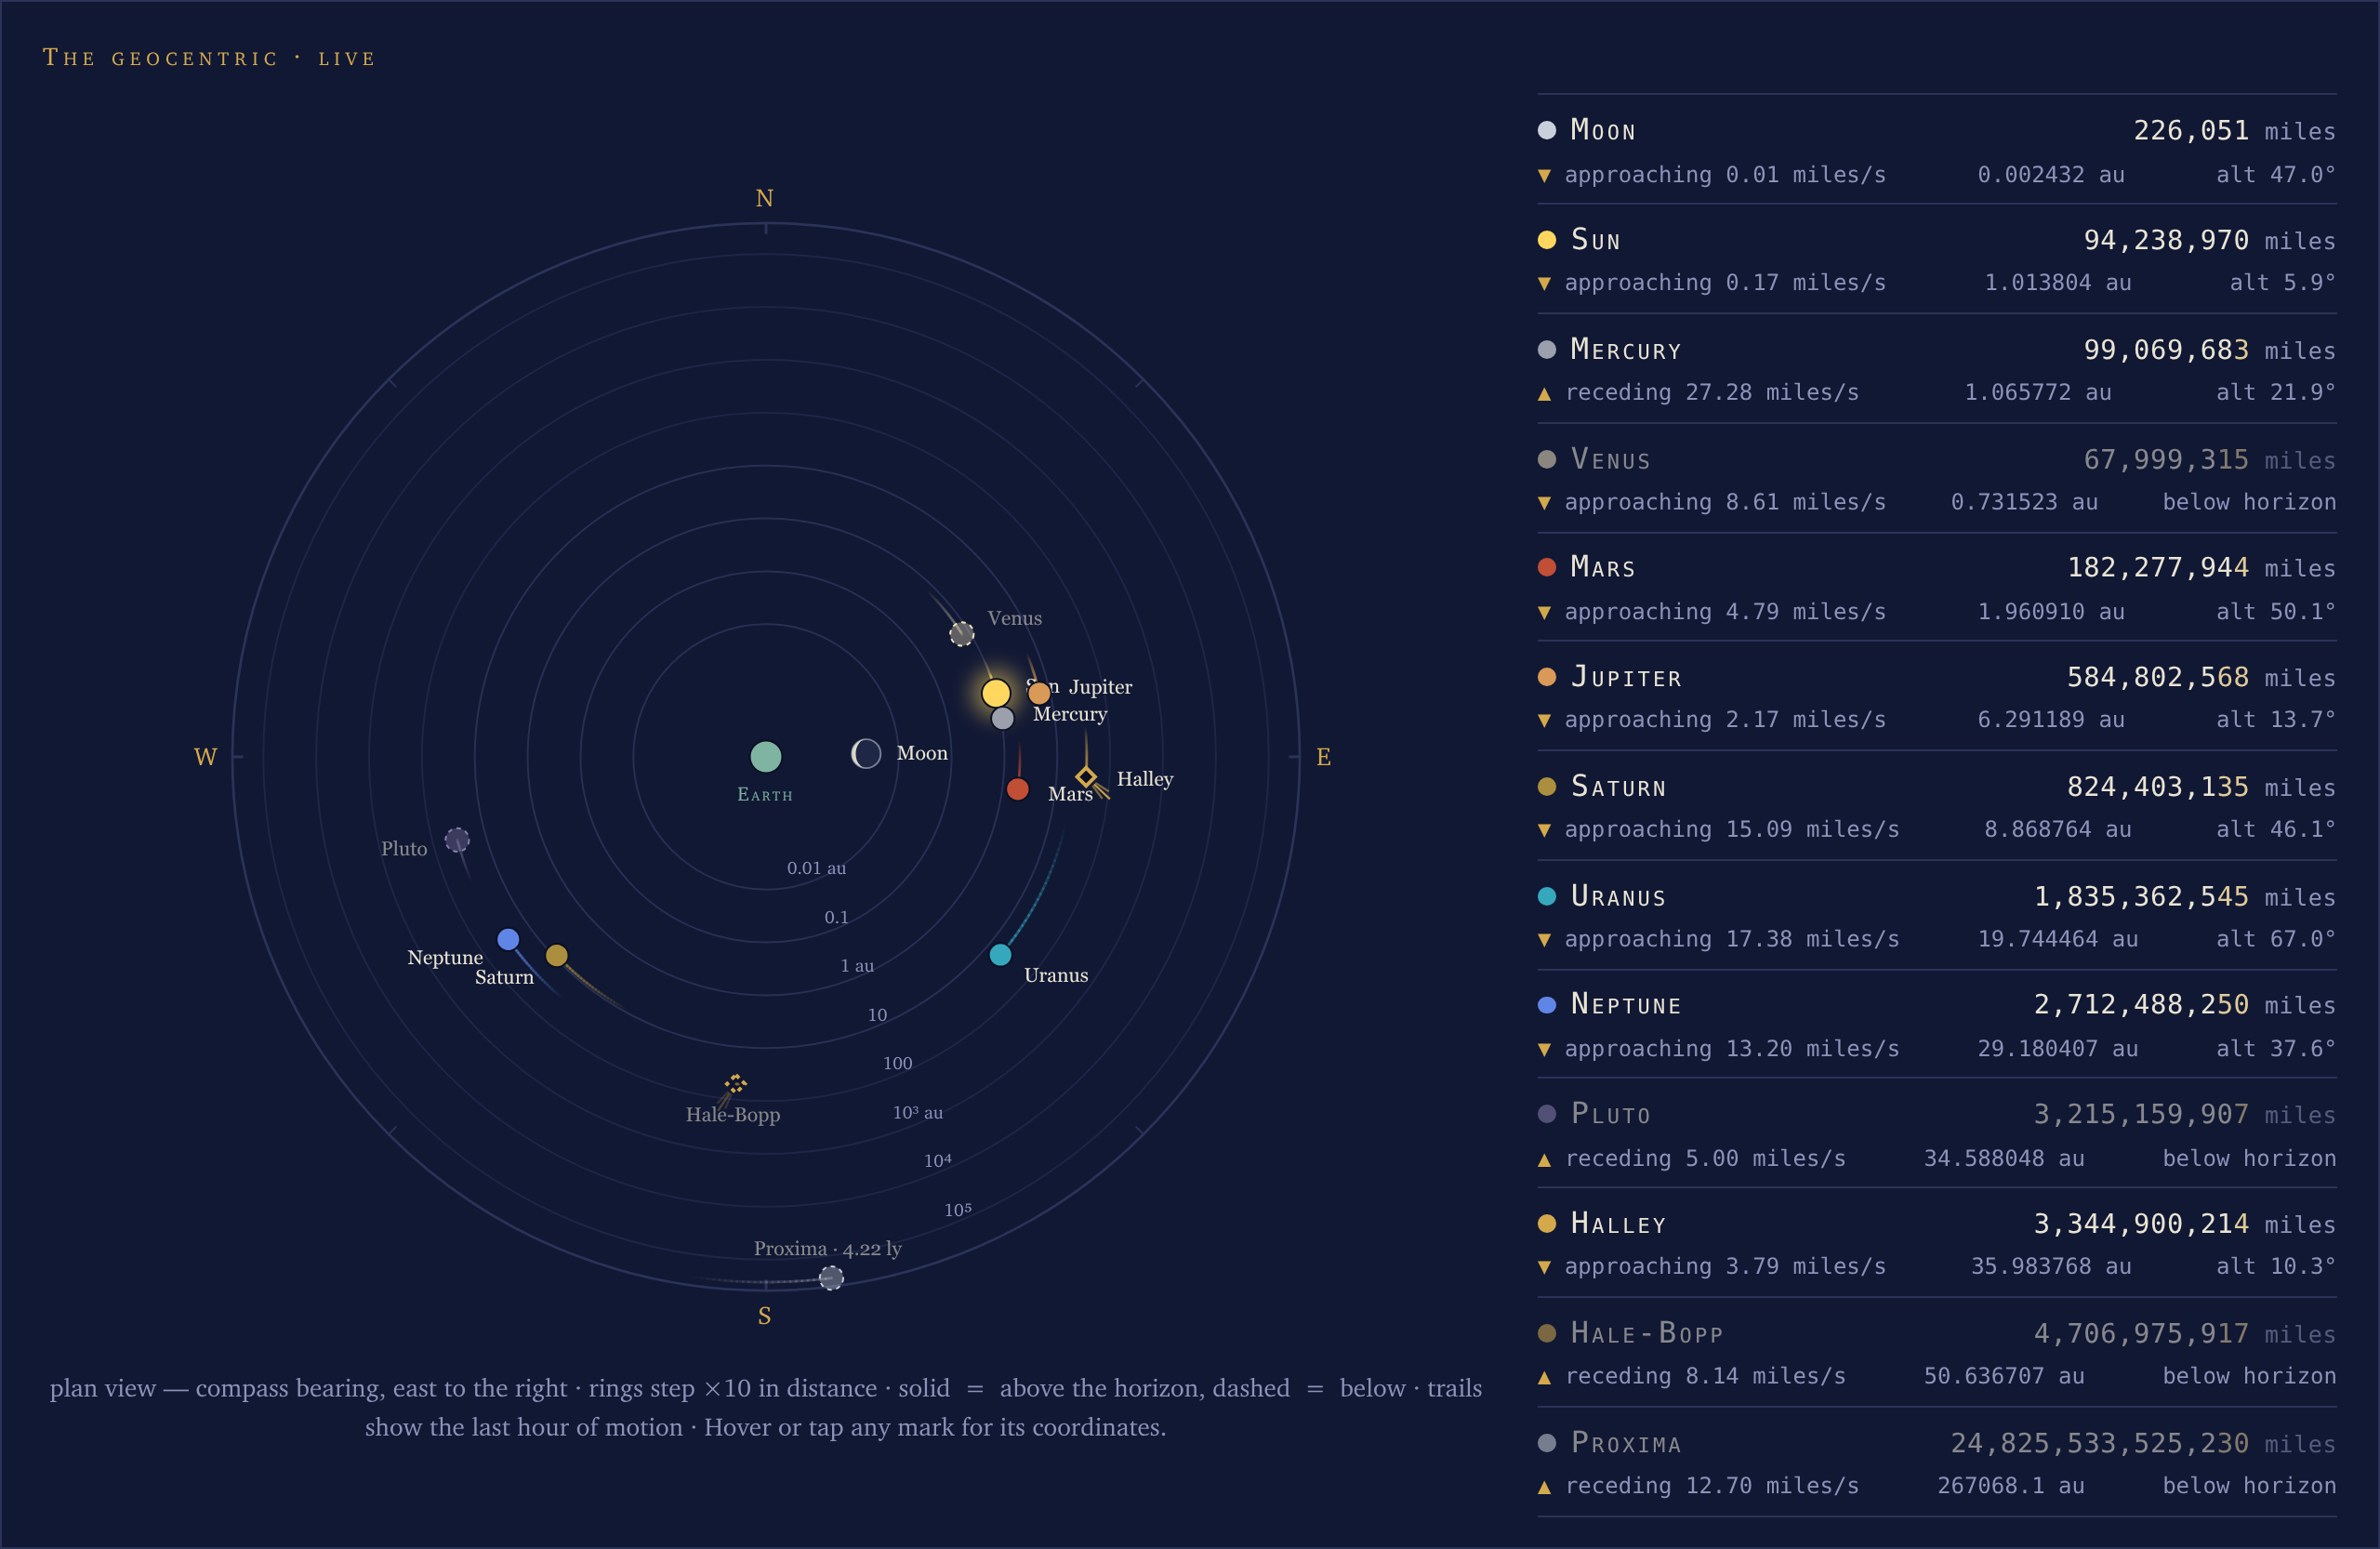
Earth sits at the center. Every body is placed by compass bearing — its azimuth — and by distance from Earth on a logarithmic radius, one ring per factor of ten, from a hundredth of an astronomical unit at the center out to Proxima Centauri at the rim.
The dial is a plan view with east to the RIGHT, the map and radar convention — you are looking down on the station. The sky dome below it is a sky chart with east to the LEFT, as if lying on your back looking up. The two orientations are deliberately opposite and are not a bug: a plan view and a view of the sky simply disagree about east.
On the dial:
- Solid marks are above the horizon; dashed and dimmed marks are below it, still placed at their true bearing and distance.
- The moon is drawn as a true-phase disc — the same limb-and-terminator geometry weewx-skyfield’s Sky page uses — inside a rim of its own, so a new moon is still visible as a mark.
- The sun carries a soft glow.
- A trail behind each mark shows the last hour of motion. Trails and rates need two loop packets to exist, so for the first few seconds after the page loads the marks stand still by design.
- Every mark answers a tap: touch or hover it for its name, live altitude and live distance.
Configured comets ride the same dial, drawn as diamonds between Neptune and Proxima in the roster order:
- The three-ray tail fans away from the sun’s own dial point — anti-sunward, as a real comet’s tail points.
- The diamond is solid when the comet is naked-eye bright (magnitude 6.0 or brighter) and hollow when it is fainter or its magnitude is unknown.
- A comet the Minor Planet Center has dropped from its element file renders as honest absence: no diamond, an empty roster row.
The roster beside the dial
Each row is one body: a colored chip and its name, then the headline distance odometer in your report’s distance unit, then a sub-line carrying three things — whether the body is approaching or receding, the raw distance in astronomical units, and the current altitude (alt 34.7°, or below horizon, in which case the body’s name and distance step down to the secondary text color, matching its label on the dial).
The odometer is the page’s party trick: between loop packets it ticks at the body’s true radial rate, so Mercury can visibly recede about 28 km every second while Saturn closes at the same pace. Each packet re-anchors it to truth, and the digits that change flash brass.
The sky dome
The dome is everything above the horizon right now — weewx-skyfield’s own chart, the full Hipparcos star field and the constellation figures included, embedded here as a live instrument. It is drawn in sky-chart orientation: north at the top, east at the left, as if lying on your back looking up. Altitude rings mark 30° and 60°, the rim is the horizon, and the dome is strictly the current sky — one chart, one instant.
The backdrop steps once a minute rather than once a report cycle: each cycle renders a staggered set of backdrops and the open page picks the one covering the current minute, so the sky advances by a quarter of a degree at a time instead of lurching. Between steps the sun, moon and planet marks are nudged at loop-derived rates.
If the backdrops stop arriving — the station stops generating them, or the page cannot fetch them — the whole dome freezes rather than moving its marks across a star field that has stood still, and a line under the panel says so and names the fault. A frozen dome is honestly old; a moving one over a frozen sky would be wrong. See The star field is frozen.
With satellites configured, the dome carries the one class of thing up there that genuinely moves fast. A satellite marker is:
- A solid dot when the satellite is sunlit — the state in which you could actually see it.
- A hollow ring when it has crossed into Earth’s shadow. This is how visible passes really end: the satellite does not set, it simply goes out.
- Dimmed whenever your sky is too bright for it to be visible anyway.
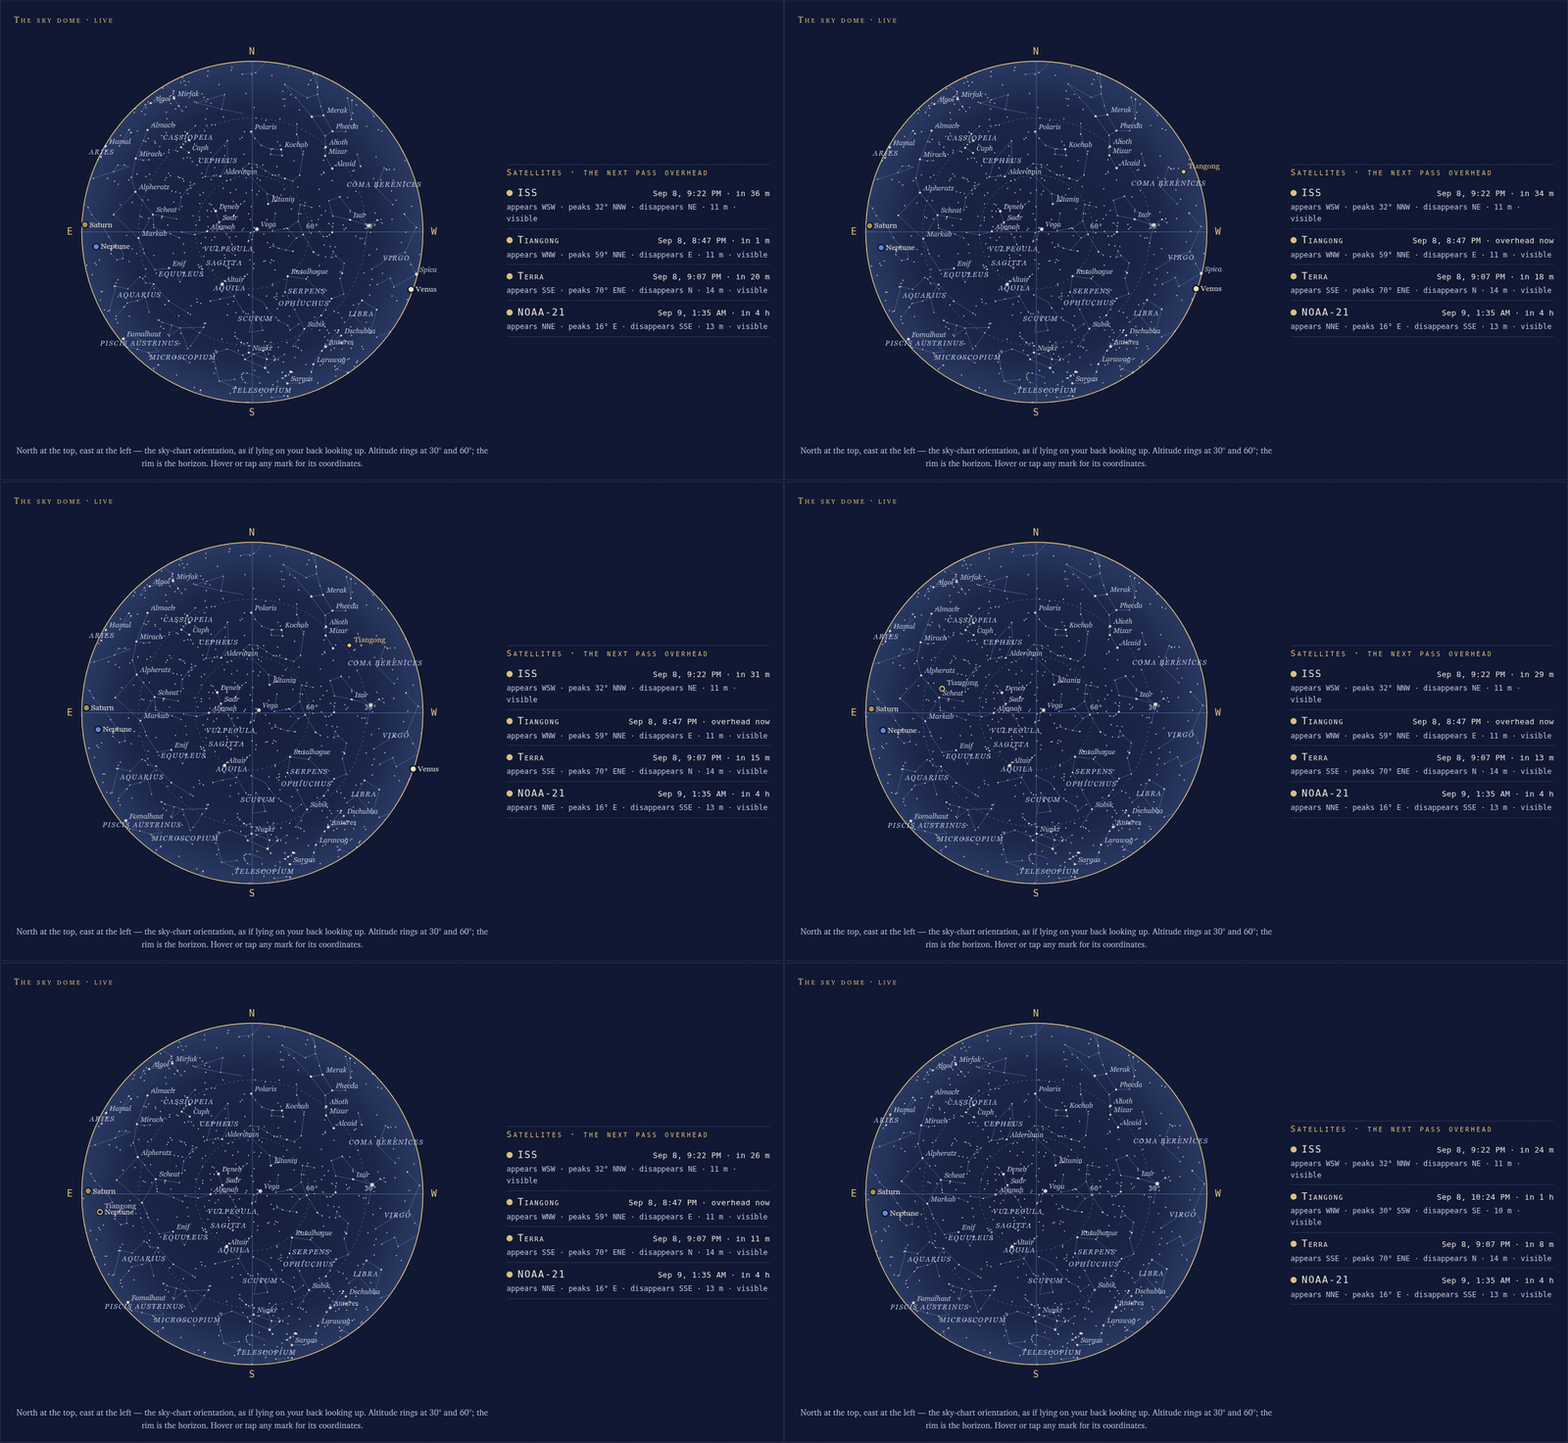
Beside the dome, the next pass overhead roster gives every configured satellite a row counting down to its next pass of any kind, tagged visible or not visible, rolling to overhead now during the pass. Two honest rows replace a countdown when there is nothing to count: no pass in the coming week, and no usable orbital elements — see the weewxd log when the elements could not be fetched or have expired.
The Next Visible Pass
This panel is the visible-pass story, and it charts exactly one pass: the soonest upcoming visible one across all your satellites. The whole sky is drawn as it will stand at that pass’s highest point, on the date in the head line, with the pass’s arc dashed across it and the rise and set times at the ends. One chart, one instant — so the arc crosses the stars it will really cross. Only stars bright enough for a twilight sky are drawn, because a visible pass happens while your sky is only half dark.
During the pass itself the chart’s moment is minutes away, and the page sweeps the satellite’s dot along the drawn arc in real time, flipping it between the solid sunlit dot and the hollow in-shadow ring in step with the dome’s marker.
When the pass ends, the moving dot and its name label leave the chart — the satellite has set, exactly as its mark disappears from the sky dome at that instant. The arc, the head line and the rest of the drawn sky stay until the next chart arrives a few minutes later, so in that gap the panel shows the record of the pass that has just finished, with no satellite on it. A page opened in that gap comes up the same way once its first loop packet lands, normally a second or two after it loads: until then the chart stands exactly as the station drew it, dot included, and it keeps standing that way for as long as the loop feed is down. The page reads the pass’s own rise and set from the chart itself.
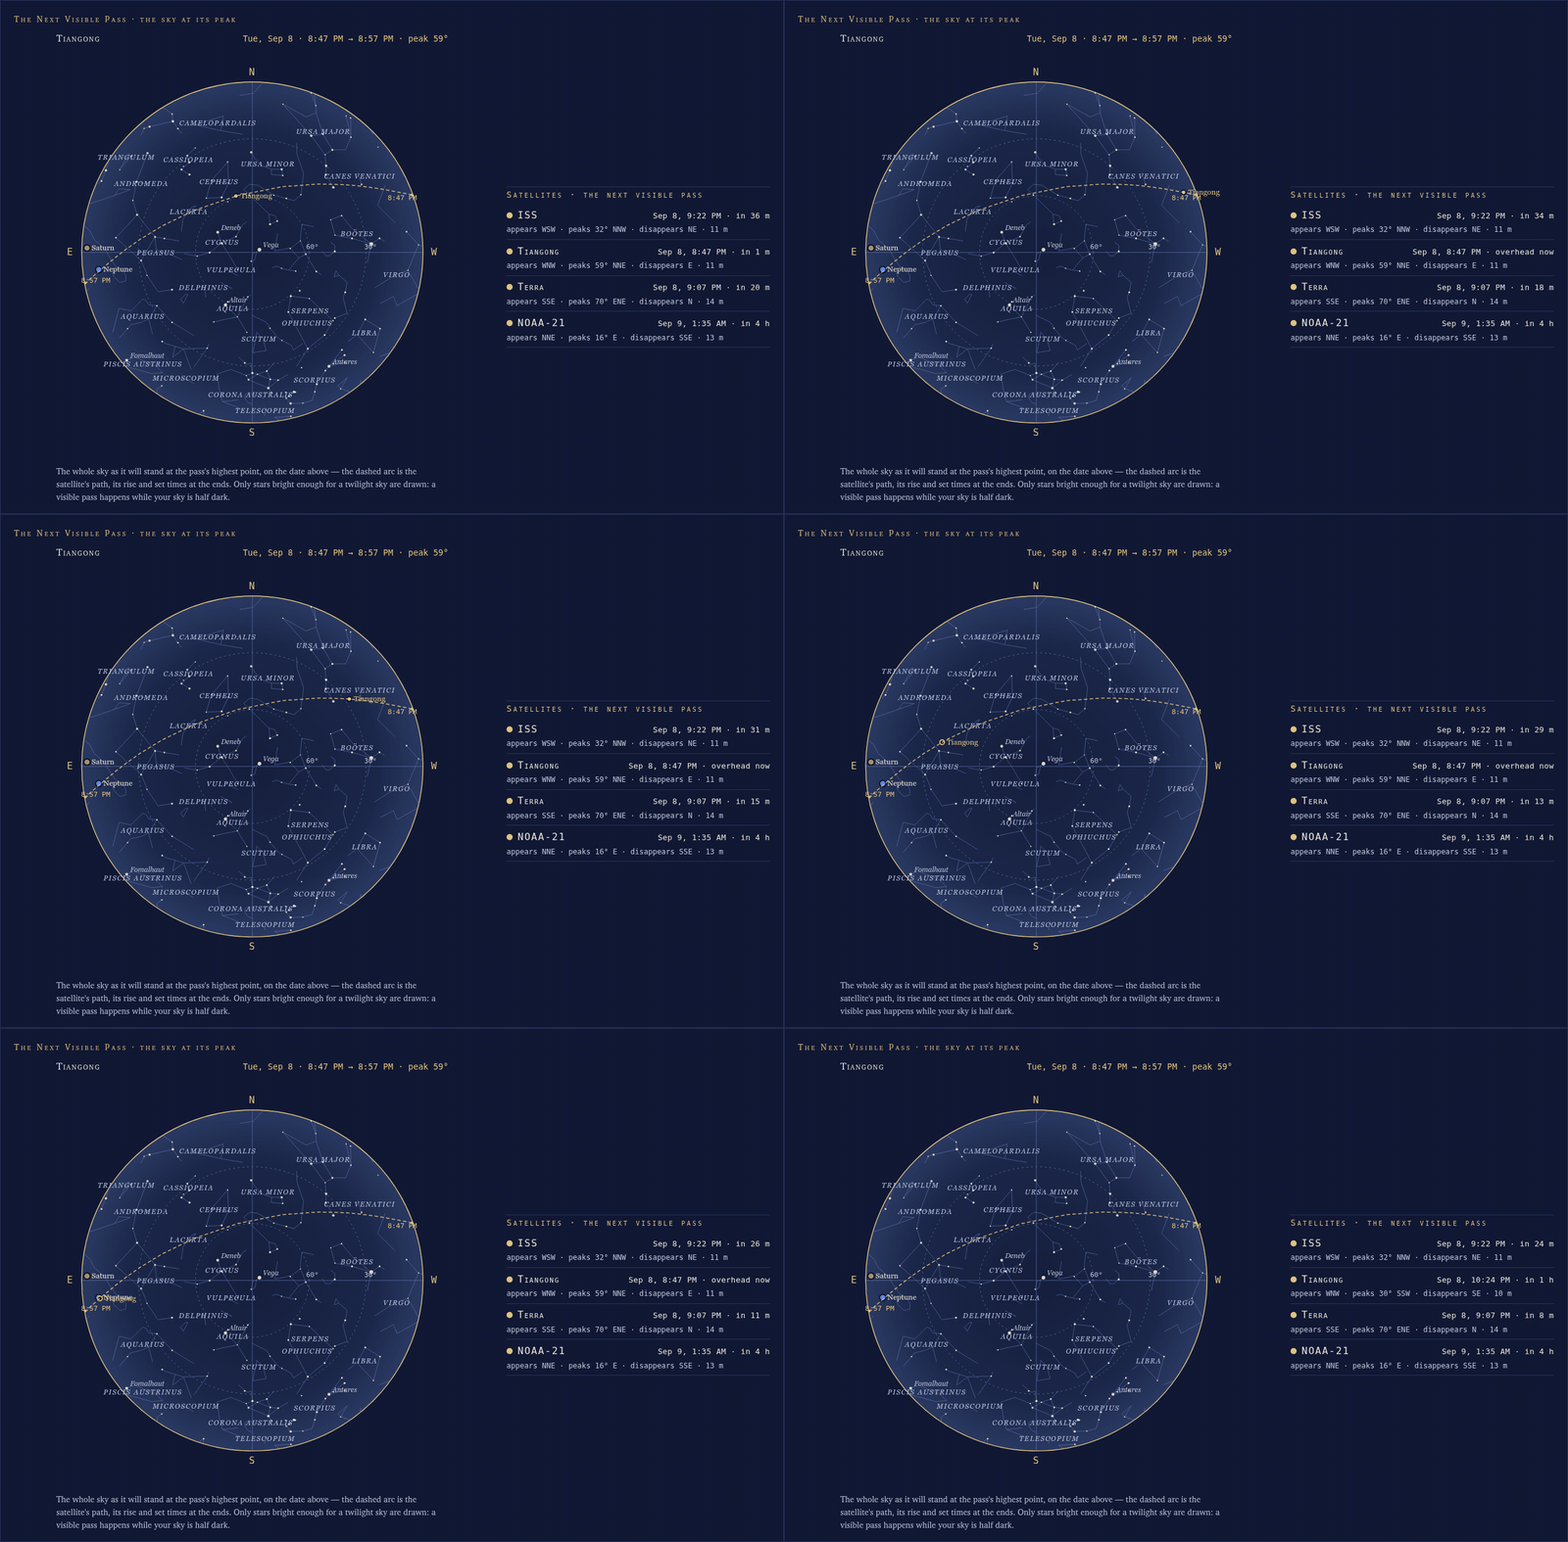
The chart refetches every five minutes and rolls over to the next pass by itself. When no configured satellite has a visible pass inside its elements’ validity window, the chart area hides and the roster’s rows say why.
The footer
The footer names the almanac that actually computed the page — the full Skyfield, DE421 and Hipparcos credit when weewx-skyfield served it, a generic line for PyEphem, and WeeWX’s built-in almanac when that is the truth — followed by the note that the values arrive live via weewx-loopdata. It is generated per tier, so it never claims a computation the page did not get.
A short glossary
- Visible pass — a pass during which the satellite is sunlit while your own sky is dark enough to see it. Most passes are not visible.
- Sunlit — the satellite is in sunlight, above Earth’s shadow.
- Culmination — the highest point of a pass.
- Magnitude — brightness, smaller is brighter; about 6.0 is the naked-eye limit under a dark sky.
- Astronomical darkness — the sun 18° or more below the horizon, when the sky is as dark as it will get.
- Perihelion / aphelion — the closest and farthest points of an orbit around the sun.
- Supermoon — a full moon near the closest point of the moon’s orbit.
- ZHR — zenithal hourly rate, the meteors an ideal observer would see per hour at a shower’s peak.