weewx-xtide
weewx-xtide
Tide predictions for WeeWX — an interactive tide graph, plus
$xtide.events() tags for your own reports, powered by
XTide.
Installation · Configuration · Tags in your skin · Translating (i18n) · GitHub project
weewx-xtide runs XTide’s tide program for a station you choose, keeps the
high/low tide predictions in its own small database, and serves them to
WeeWX reports two ways:
The bundled sample report is an interactive tide graph: continuous tide levels with the high and low tides marked, tabs for 2-day, 7-day and 30-day views, night (sunset to sunrise) shading, a “now” line, and click/hover anywhere on the curve for the exact time and tide level. The tidal events for the selected view are listed below the graph. The page is self-contained — no javascript libraries, nothing fetched at run time.
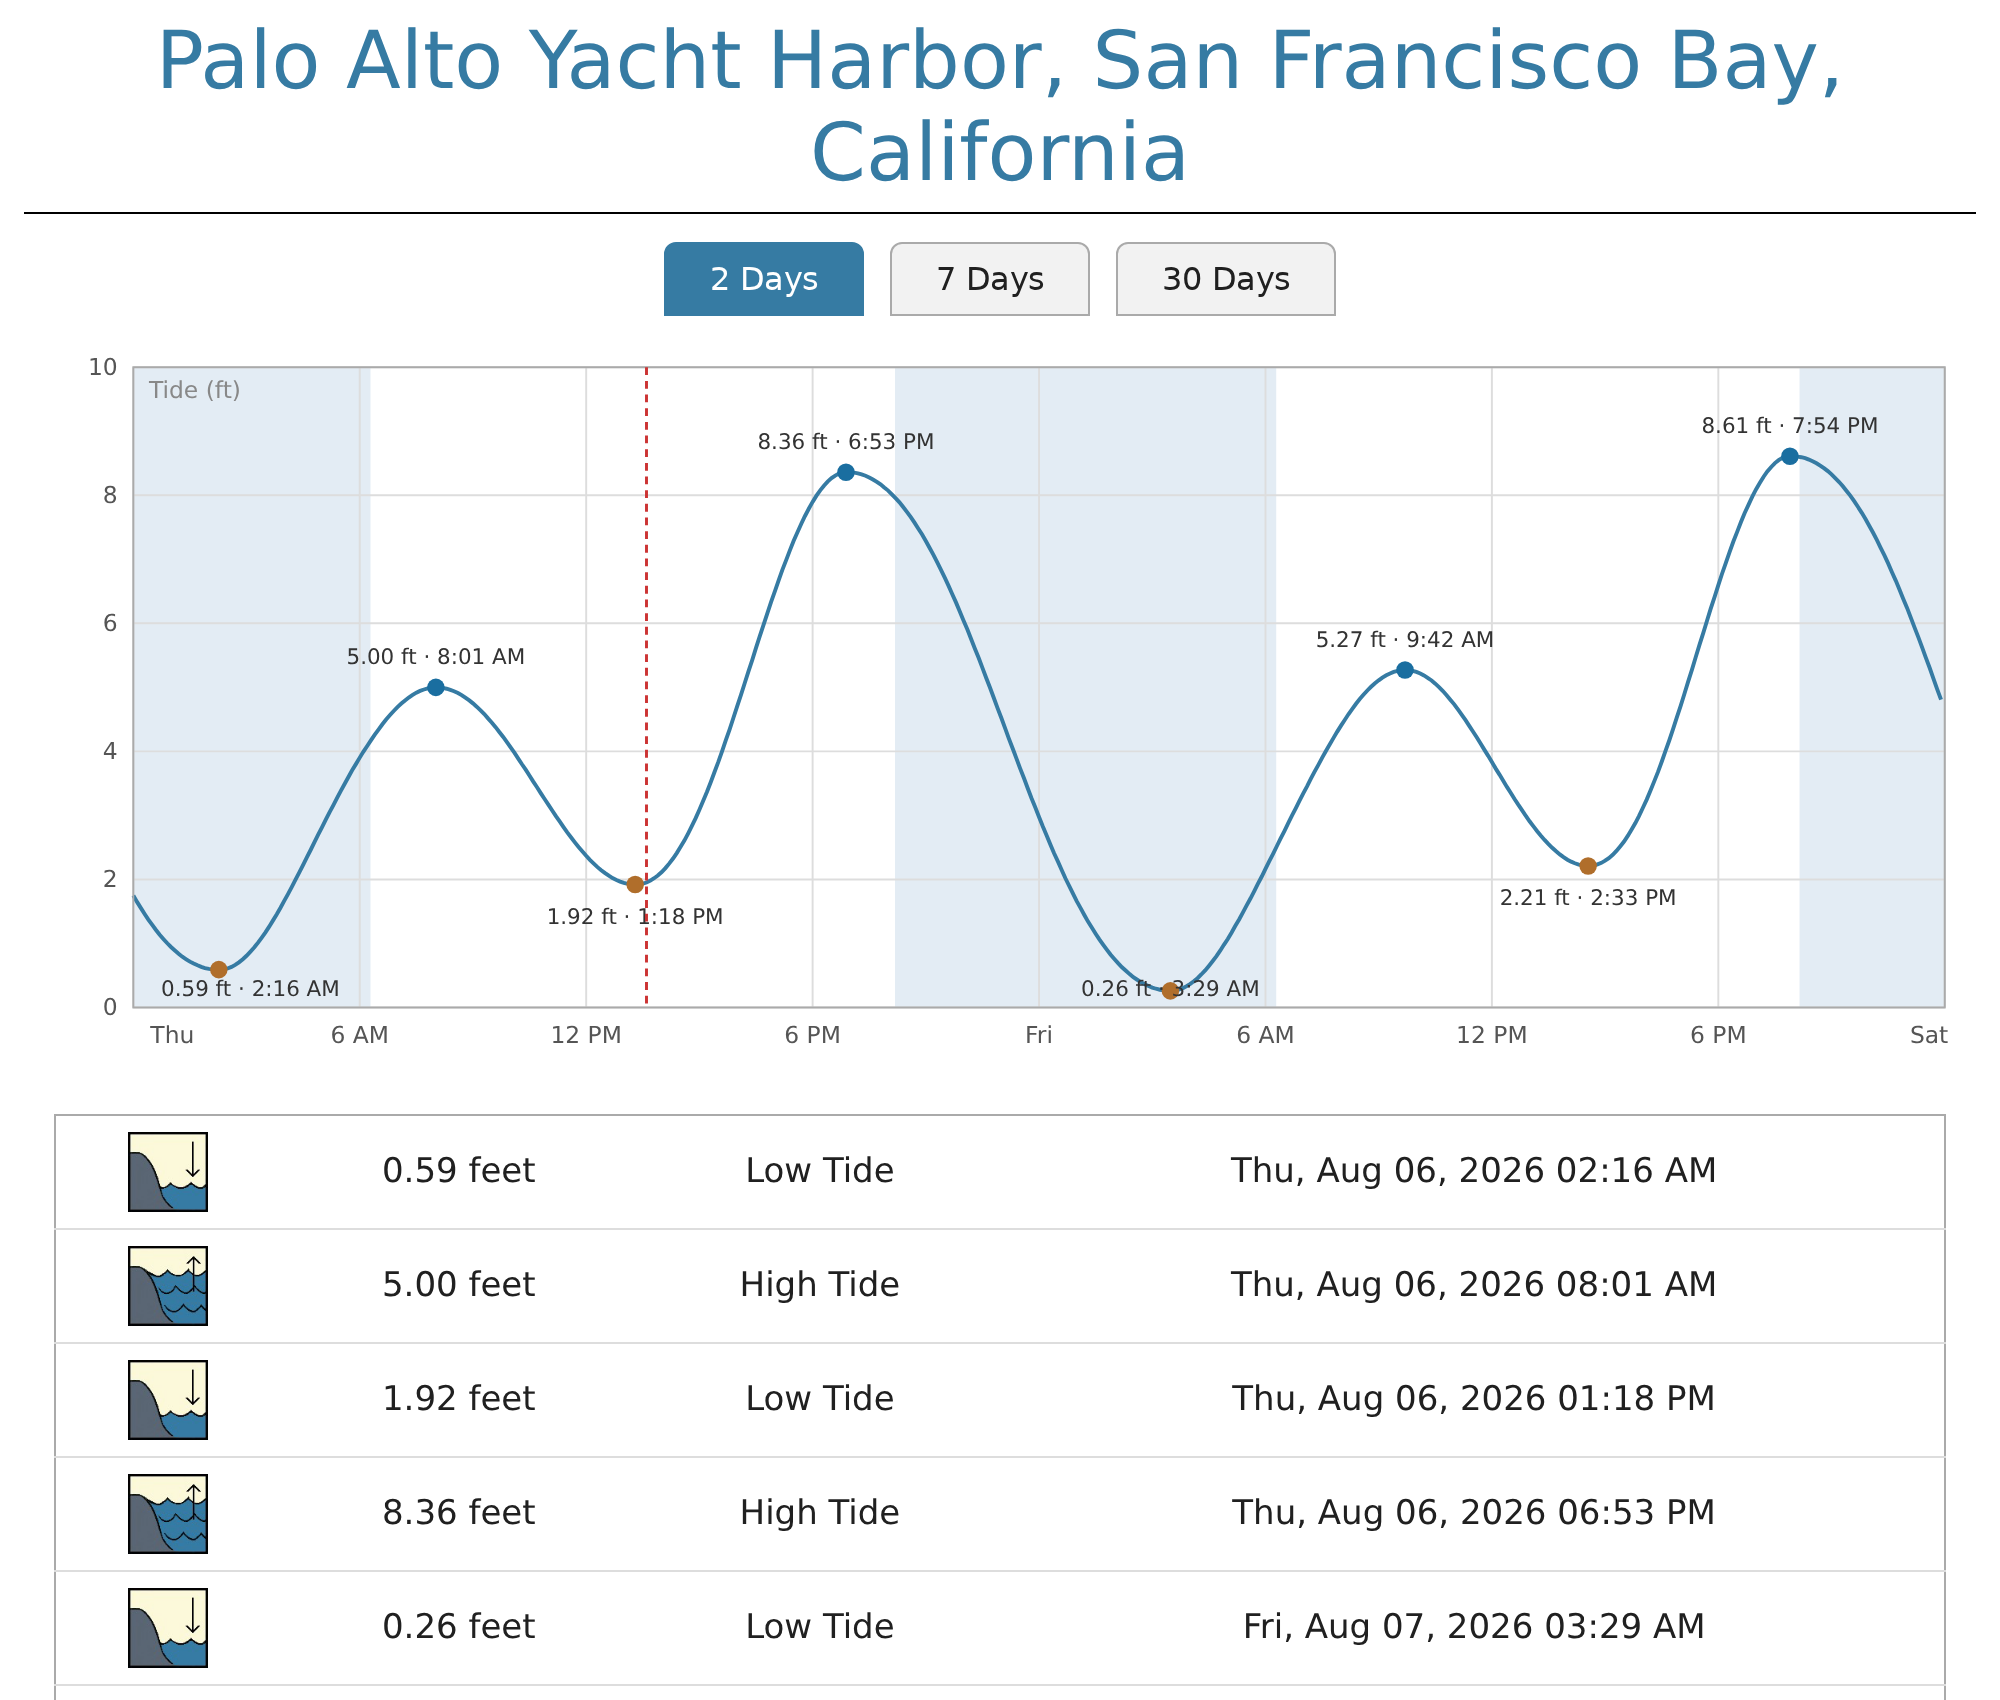
The sample report speaks nine languages — English, Danish, Dutch, French,
German, Italian, Norwegian, Spanish and Swedish. One lang line in
weewx.conf switches: see Translating (i18n).
The $xtide.events() tag gives any report the upcoming high and low
tides as data — time, type and level, with WeeWX’s own unit and time
formatting. PaloAltoWeather.com’s tides page
is built on it. See Tags in your skin.
Requirements
- Python 3.10
- WeeWX 4 or 5
- The xtide package, built from source per Installation
License
weewx-xtide is licensed under the GNU Public License v3. Copyright 2024-2026 by John A Kline (john@johnkline.com). Icons by JChiaWorks. XTide is Copyright 1998 David Flater; U.S.A. harmonics from the National Ocean Service.