weewx-xtide
Tags in your skin
Home · Installation · Configuration · Translating (i18n) · GitHub project
$xtide.events()
$xtide.events() returns the upcoming tidal events from the database — as
many days as the days option keeps (see
Configuration). Pass a count to cap the list:
$xtide.events(max_events=4).
#for event in $xtide.events()
    $event.location
    $event.dateTime
    $event.eventType
    $event.level
#end for
Sample values:
$event.location : Palo Alto Yacht Harbor, San Francisco Bay, California
$event.dateTime : 2024-07-11 04:03:00 PDT
$event.eventType: High Tide
$event.level    : 6.34 feet
dateTime and level are WeeWX ValueHelpers: $event.dateTime formats
with your report’s time settings, and $event.level renders in feet or
meters per the report’s unit system (%0.2f, with a ` feet/ meters
label). eventType is the string High Tide or Low Tide`.
$xtide.graph()
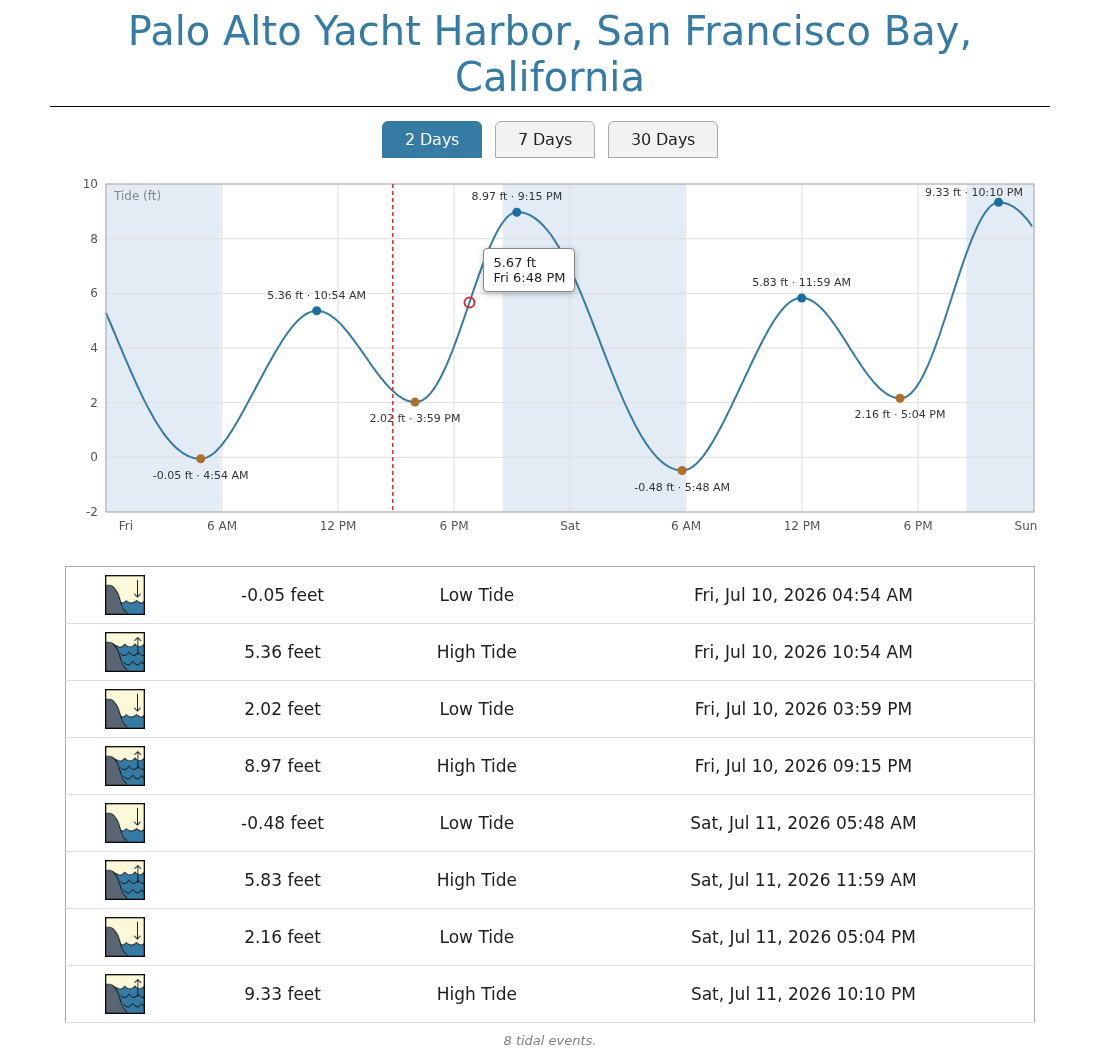
$xtide.graph() builds everything the sample report’s interactive tide
page shows, for embedding in your own skin. It returns None if the tide
program could not be run (guard for that and render a hint); otherwise:
| Property | What it is |
|---|---|
$g.location |
The station name, as the harmonics file spells it |
$g.unit |
ft or m, as the tide program reported levels |
$g.svg_day, $g.svg_week, $g.svg_month |
Finished inline SVGs: the 2-day, 7-day and 30-day views |
$g.json |
The data payload for xtide.js (tabs, tooltip, “now” line, event-list filtering) |
$g.events |
Display rows for the event list: ts, eventType, icon, level_str, time_str |
The sample skin’s index.html.tmpl is the reference consumer: it embeds
the three SVGs, emits <script>var XTIDE_DATA = $g.json;</script>, and
loads xtide.js. Everything visual is styled through xg-* CSS classes
(xtide.css in the sample skin) — restyle those in your own stylesheet
rather than editing the SVG generation. The graph always covers 30 days
and runs the tide program at report time; it does not read the events
database.
PaloAltoWeather.com’s tides page
is an example of $xtide.graph() embedded in another skin, restyled
entirely through the xg-* classes.